Inno-QSAR Application
1. Overview of Inno-QSAR Application
Inno-QSAR Application is a derivative module of Inno-QSAR. Inno-QSAR is used for creating and evaluating models, while Inno-QSAR Application utilizes the models built by Inno-QSAR to make predictions. During model application, users only need to upload prediction data and select the desired model.
2. Instructions for Use
Users can complete the calculation in just two steps: Input data - Select the created QSAR model.
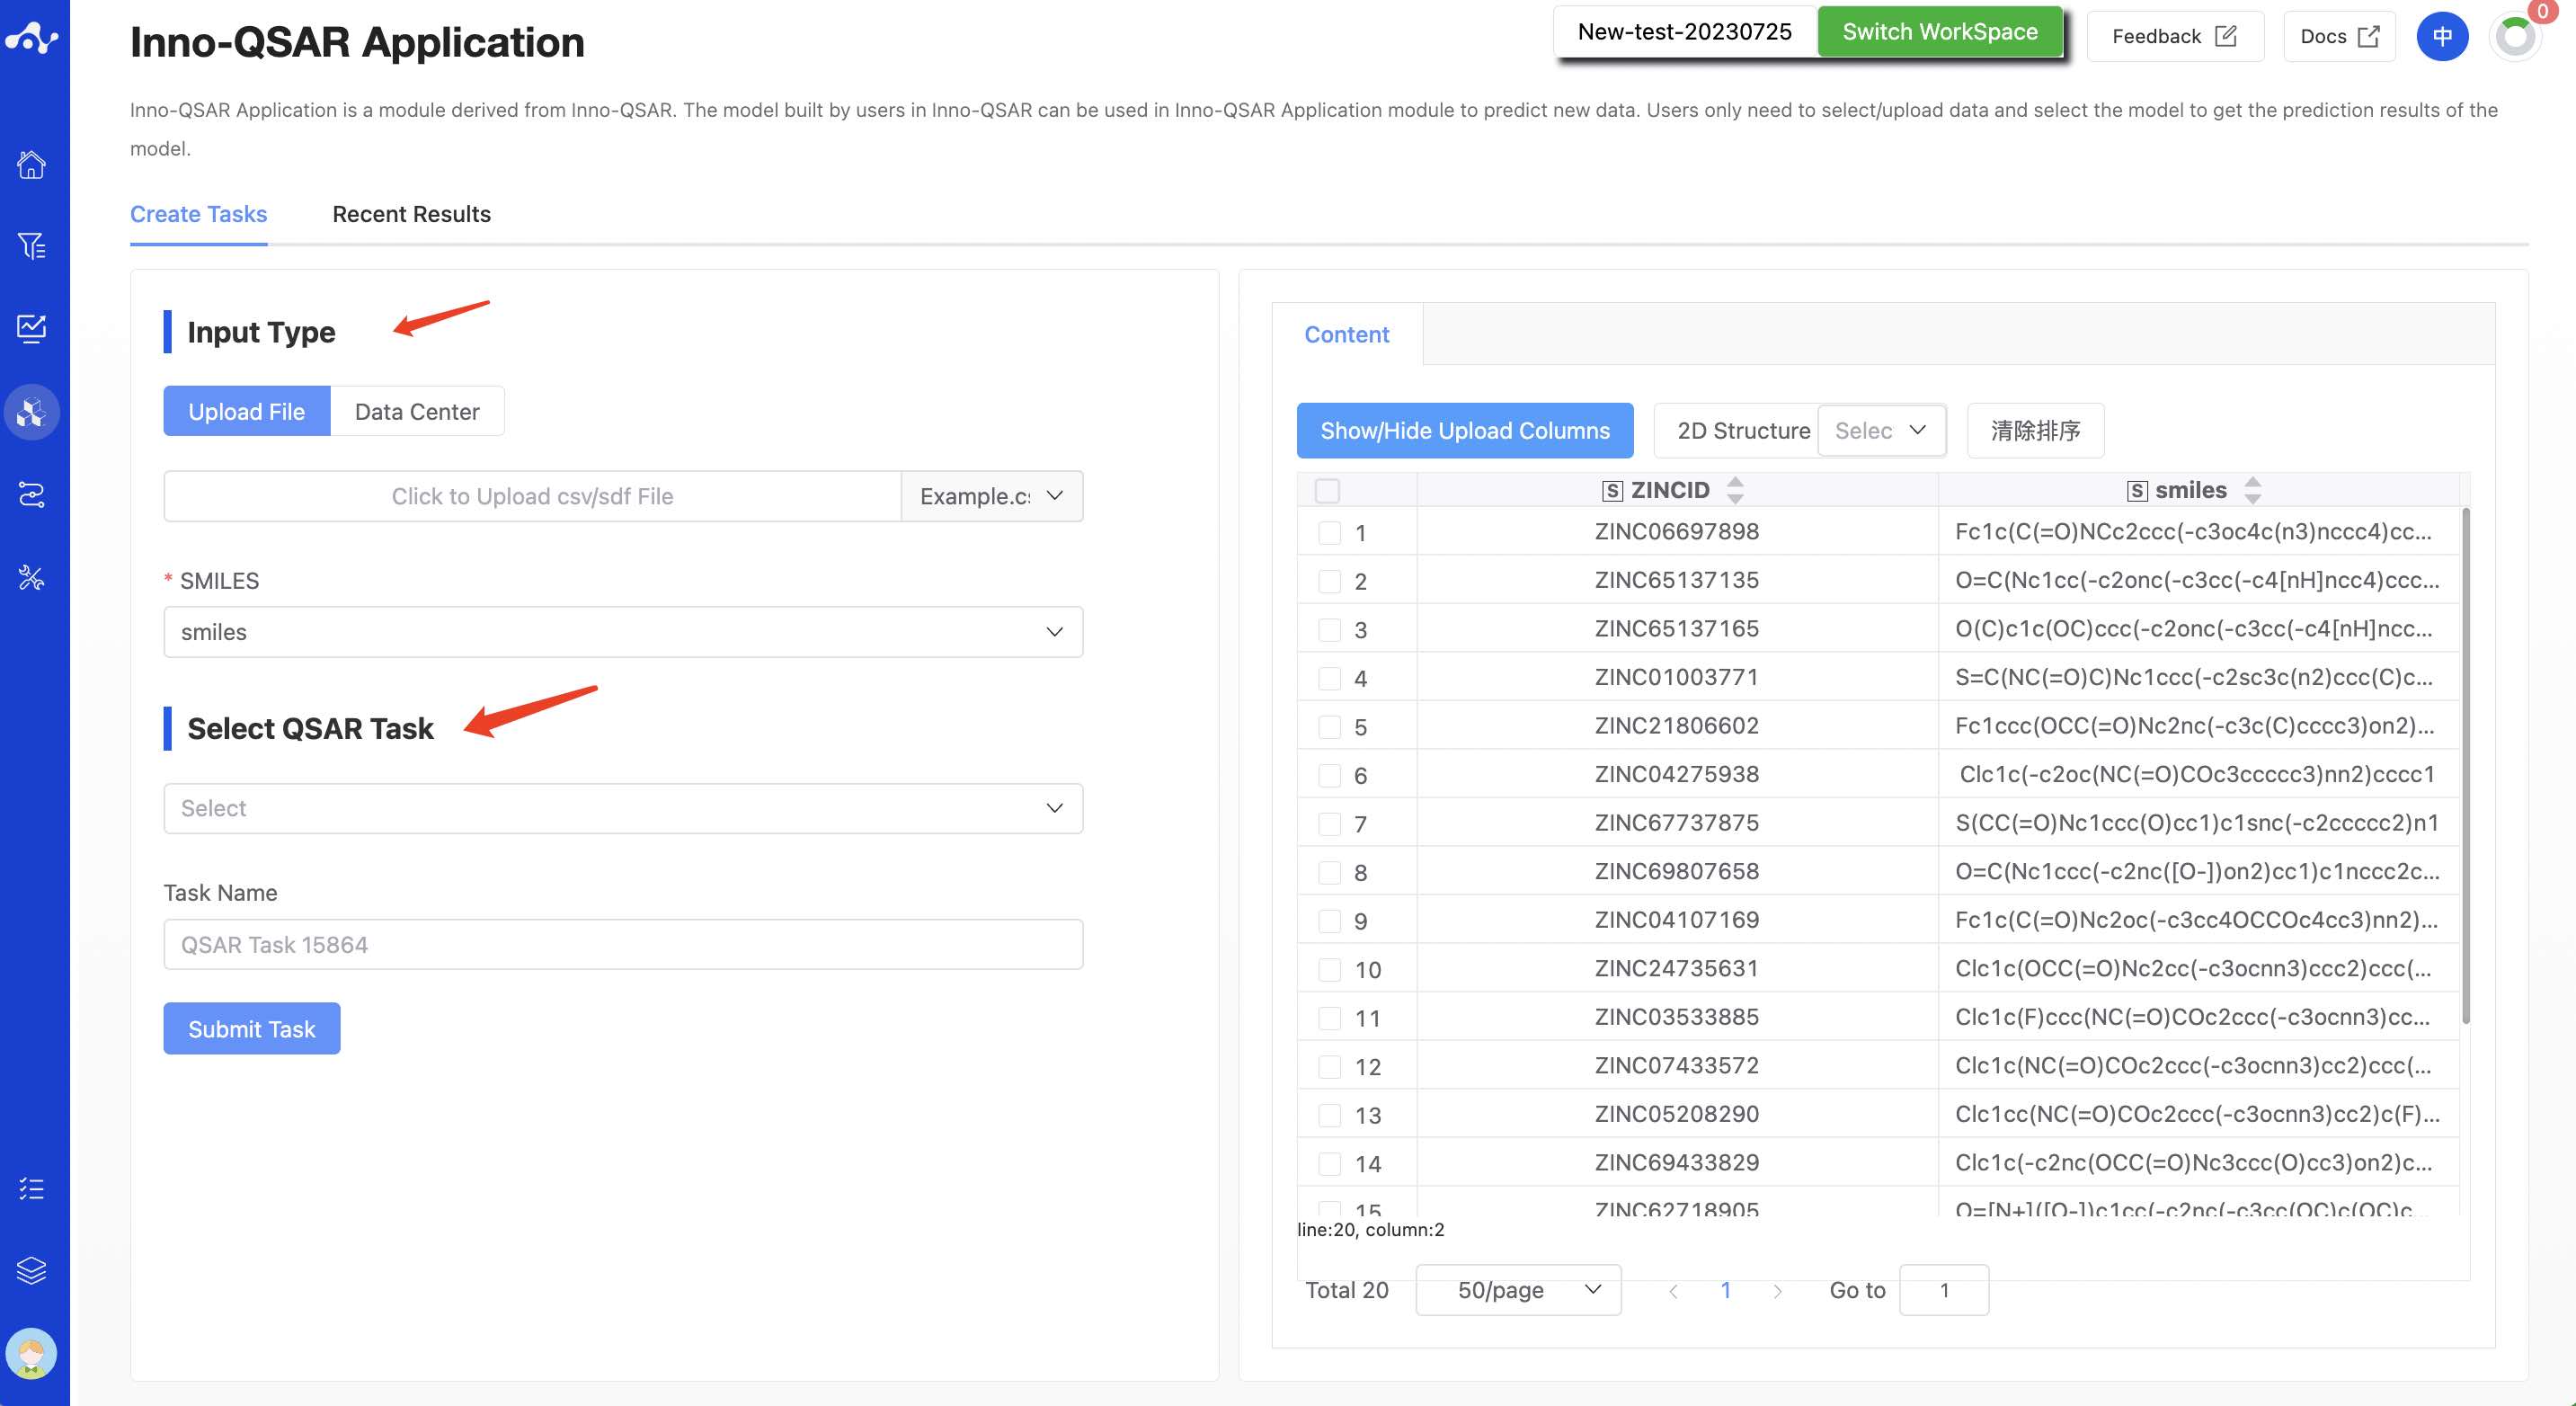
Figure 1. The page of Create Inno-QSAR Application Task
(1) Input Type
Here, upload the dataset to be predicted, and the platform provides two ways to input files: uploading files and using the data center.
- Upload File
Check the "Upload File" box, and you can select a local file by clicking the button below. After the file is selected, the file name will be displayed on the button, and the file content will be displayed on the right. Regarding the uploaded files:
The currently supported file formats are .sdf and .csv. If an sdf file is uploaded, the task can be directly submitted. If a csv file is uploaded, you need to specify the smiles column before the task can be submitted.
The file size should not exceed 10MB.
- Data Center
Check the "Data Center" box, and a pop-up window will appear when you click the button below. Click on the file name to select data from the data center. After you click, the pop-up window will disappear and you can submit the task.
(2) Select the created QSAR model
Select the corresponding QSAR task(QSAR model) in the corresponding drop-down menu.
After setting all the parameters, name the task and click submit to complete the task submission operation.
(3) Running Sataus and View Results
After the task is submitted, the page will automatically jump to the "Recent Results" subpage of the current page. Here you can view the task running status of the current module (progress bar), and you can also view all running tasks of all modules in the "Running" dropdown box in the upper right corner. Once the task is complete, a card will pop up in the top right corner of the page to notify you that a new task has been completed. You can click the "View Results" button in the card to view the results, or click the "Result Details" button on the current "View Results" page to view the results.
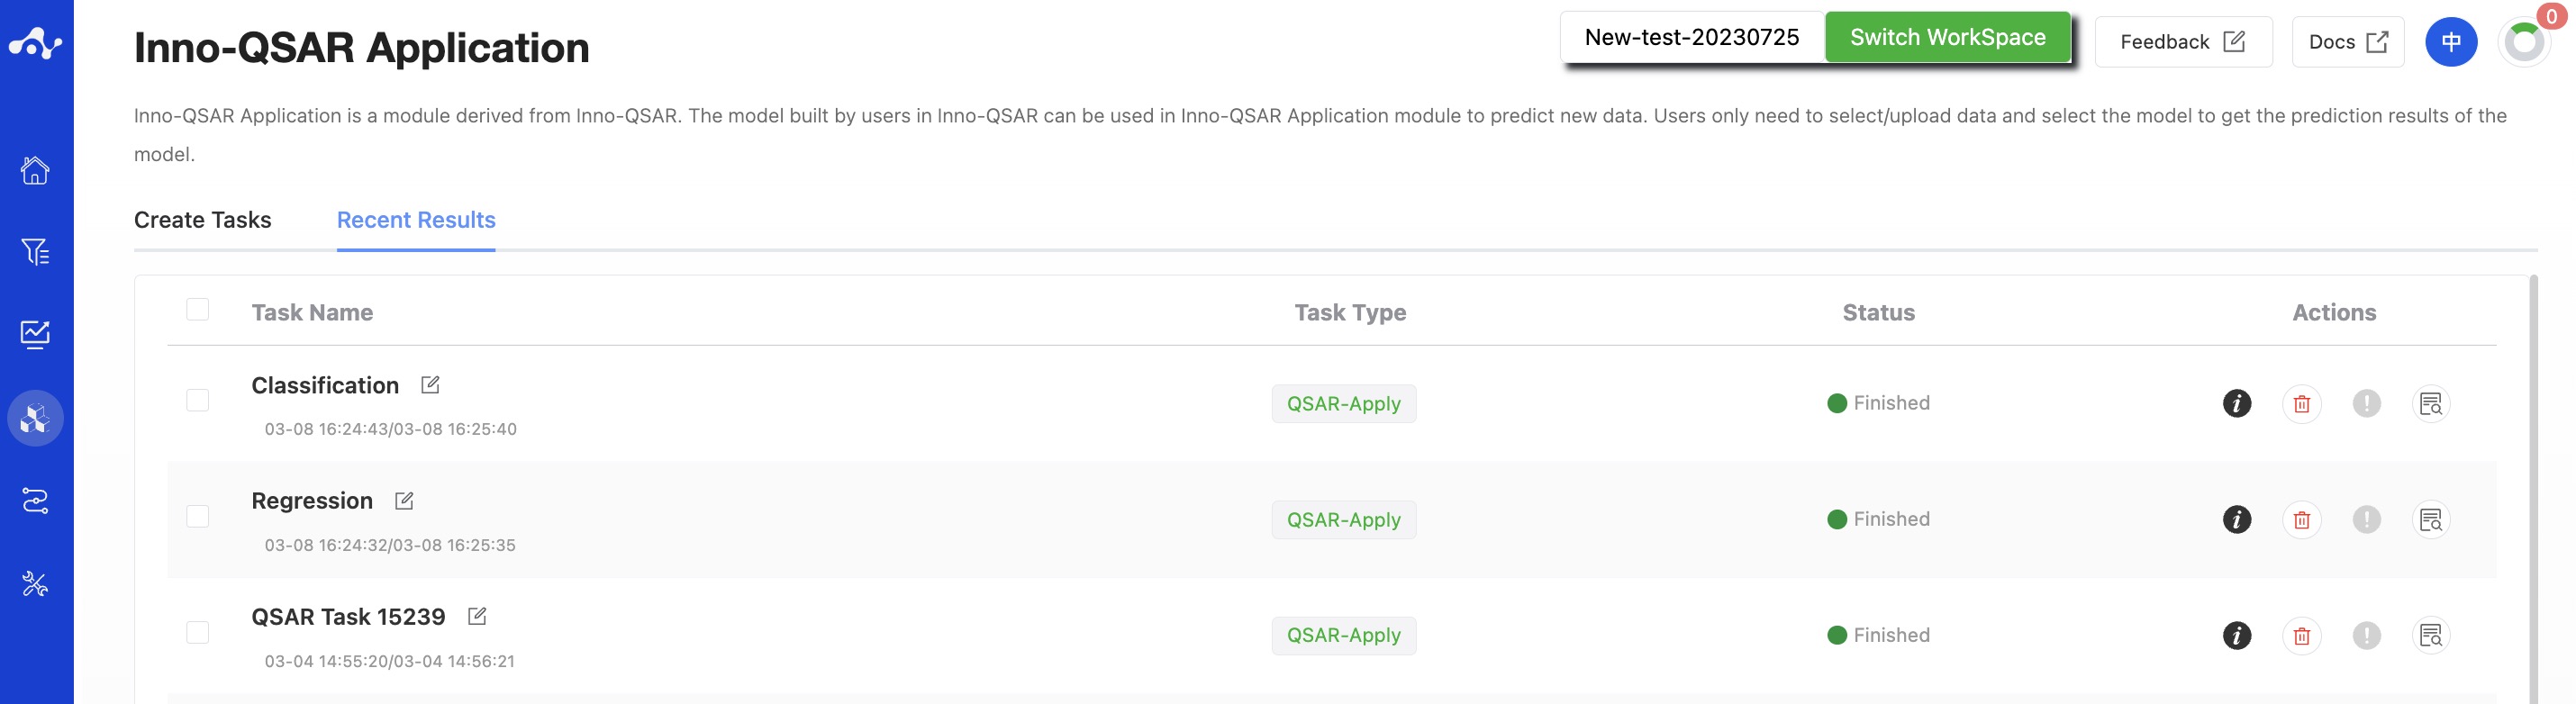
Figure 2. View Results
3. Results Analysis
On the results page, users can see the prediction results generated by the model, which corresponds to the model selected by the user on the calculation page.
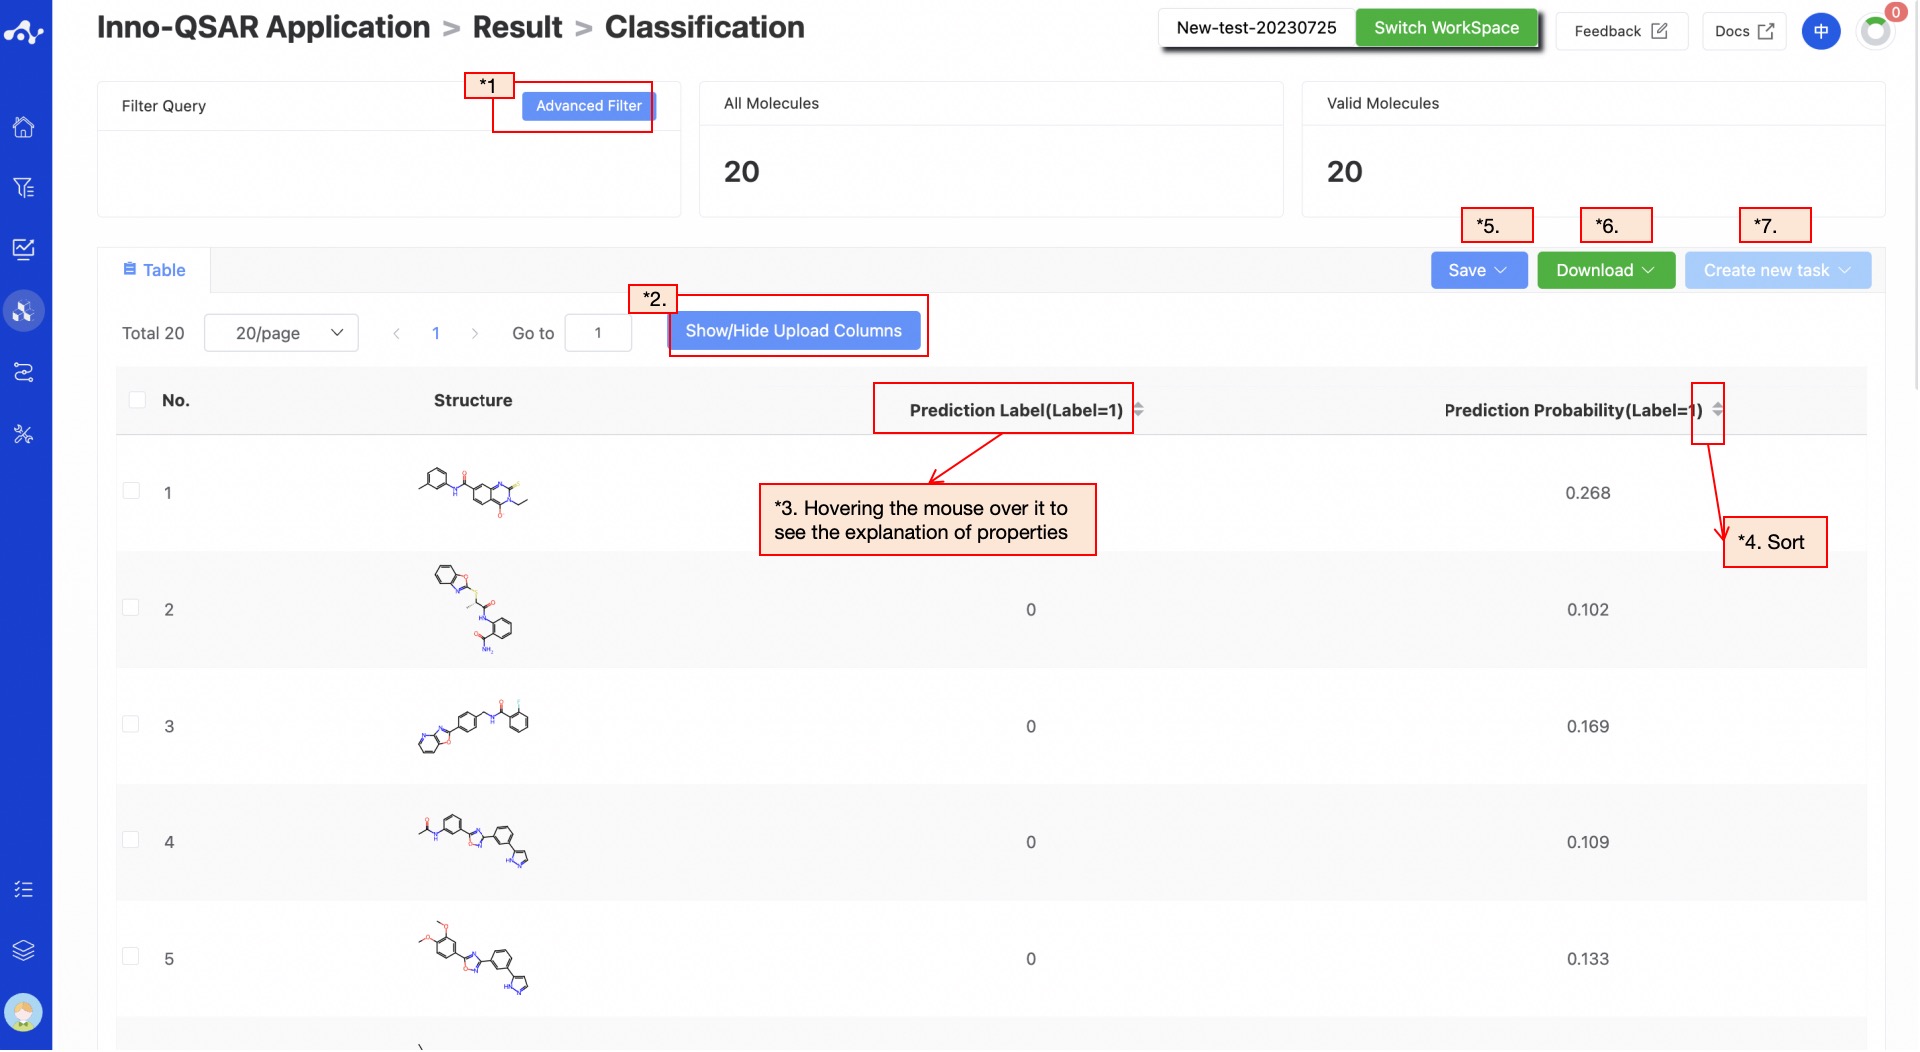
Figure 3. Results Page Function Distribution
(1) Advanced Filtering
Advanced filtering provides range filtering, which can further filter out molecules within a specified range of certain properties to exclude molecules that do not meet the expected results. After advanced filtering, only molecules that meet the filter conditions will be displayed on the page.
(2) Show/Hide Upload Column
The default result list does not display information in the uploaded file, so it is unselected in the left control bar. When you don't want to display this property, deselect it, and the result list on the left will show in real time based on the selection in the control bar. At the top, there are also two shortcuts "Select All" and "Deselect", which are convenient for users to quickly select.
(3) Property Explanation
Hover the mouse over the name of each property to view the interpretation of the corresponding attribute.
(4) Sorting
Click the property name in the result list to reorder. For example, F(20%), click once for ascending order, click again for descending order, and click a third time to restore the original order.
(5) Save
Click "Save", and the system will pop up a dropdown box for you to choose the file format to save (currently only supports .csv/.sdf). Once you have determined the style of the file to save, save the corresponding data to the data center as a sdf or csv file. The saved content is the molecules of the effective number displayed on the page, which are usually obtained according to your show/hide column conditions, advanced filtering conditions, favorites, or dislikes.
(6) Download
Click "Download", and the system will pop up a dropdown box for you to choose the file format to download (currently only supports .csv/.sdf). After determining the style of the file to download, the system will download the corresponding data to your local device as a sdf or csv file. The content downloaded is consistent with the save method, which also downloads the molecules of the effective number displayed on the page, which are usually obtained based on your show/hide column conditions, advanced filtering conditions, favorites, or dislikes.
(7) Create New Task
The prerequisite for creating a new task is to first save the data into a file. Before the save operation is performed, this button is disabled. As soon as the new file is saved based on the results, this button is enabled. When you click this button, the system will pop up a dropdown box for you to select the module to be calculated. After clicking, the page will immediately open a new tab and will take your saved dataset with it. After adjusting the parameters, you can submit a new task.