Inno-ADMET
1. Overview of Inno-ADMET
The Inno-ADMET module is designed to systematically evaluate the absorption, distribution, metabolism, excretion and toxicity properties of drugs, as well as some physicochemical properties and medicinal chemical properties. Numerous studies have shown that conducting an early-stage evaluation of ADMET properties can significantly improve the success rate of drug development. In order to meet various needs, the system offers two distinct models to compute drug-likeness properties: the pre-trained MERT model and the MGA model. Based on the independently collected high-quality data, both of these two models can realize the evaluation of 17 physicochemical properties, 5 pharmacochemical properties, 6 druglikeness rules, 21 ADME properties, and 27 toxic properties. From the perspective of model evaluation metrics, the MERT model generally performs better. However, in terms of whether the model provides insight into the influence of substructures on prediction outcomes, the MGA model has distinct advantages. Users can choose the appropriate computational model according to their individual needs.
2. Instructions for Use
Users can complete the computation in just four steps: choosing a method (MERT is selected by default), determining the input method (entering SMILES), naming the task (which can be ignored), and submitting the task (which is a mandatory step).
(1) Select Method
- MERT(Pre-train): This is a model based on pre-training. The accuracy of this model is higher, its predictive capacity is stronger, and it operates at high speed, requiring only 2.35 milliseconds to compute a molecule.
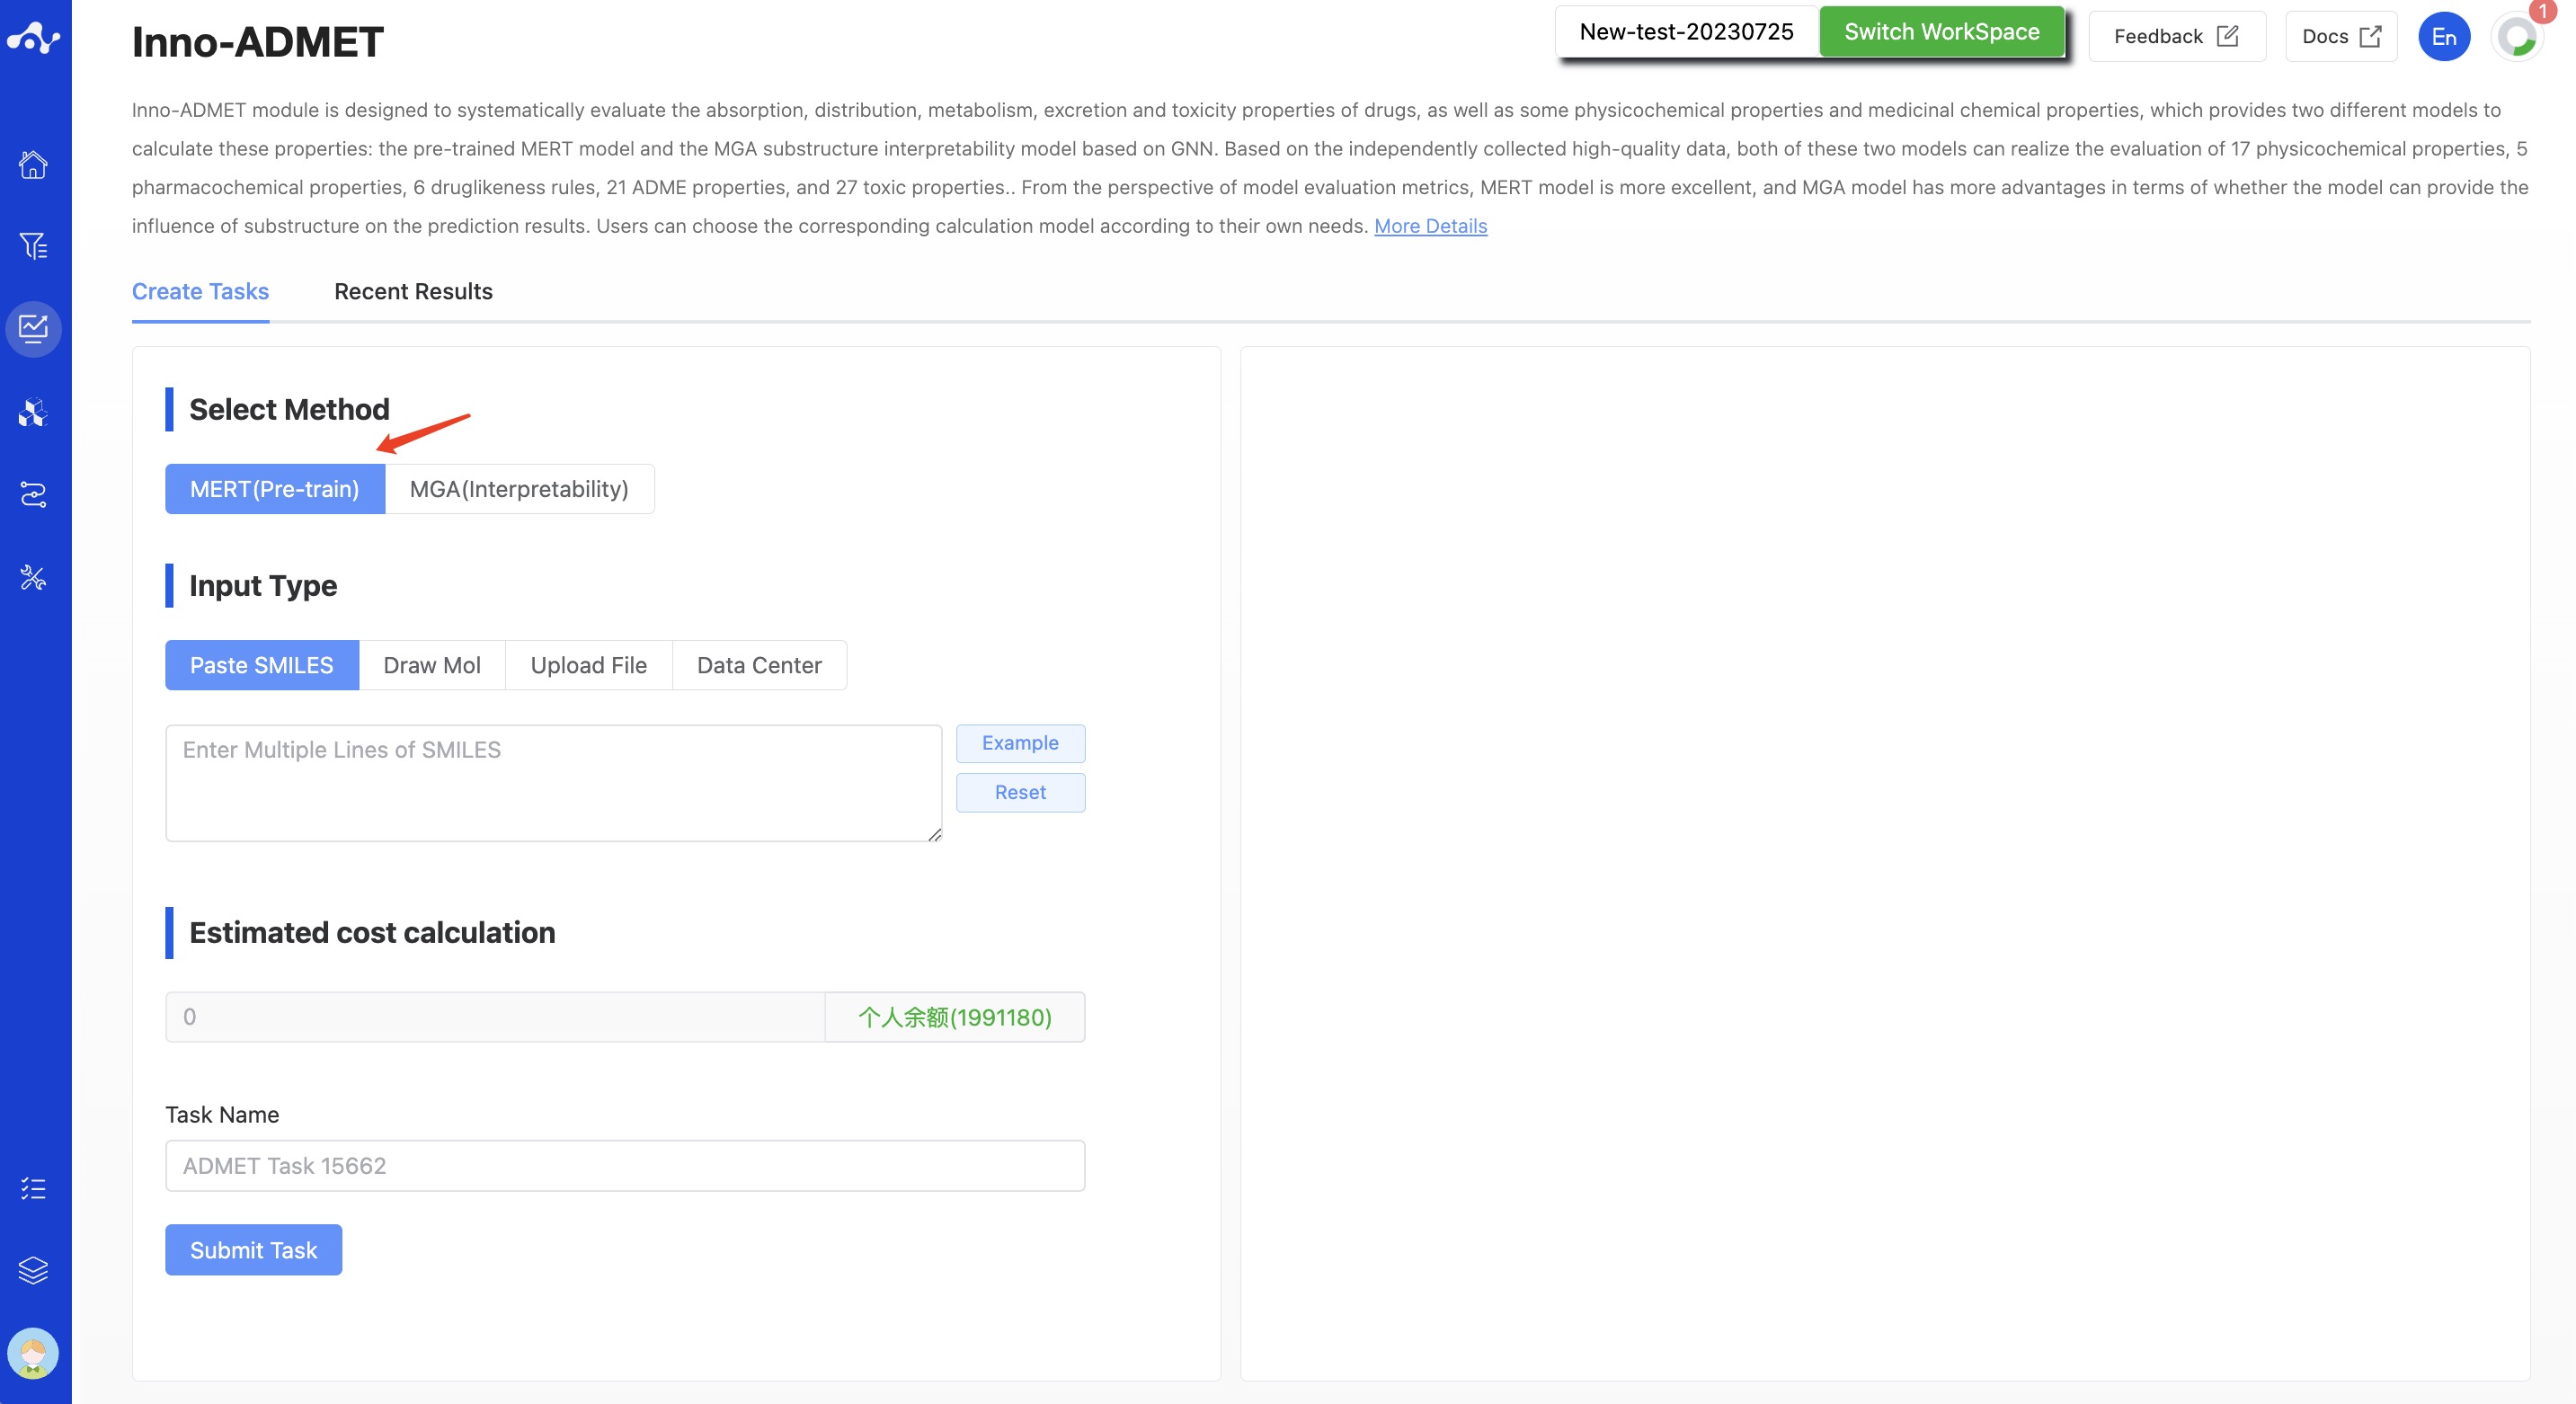
Figure 1. Create Inno-ADMET Task Page — MERT Model
- MGA (Interpretability) : This model is based on Graph Neural Network (GNN) substructure interpretability. While the predictive performance of the MGA model may not be as good as that of the MERT (Pre-trained) model, it can effectively calculate the contribution of substructures to the prediction results, helping to mine structure-activity relationships. To some degree, it can guide structural optimization. When choosing the MGA for computation, there is a switch for substructure interpretability that is controlled by the user to decide whether to compute substructure interpretability. If this switch is activated, the system will calculate the effect of substructures on the properties, but this will also increase computation time, making it not as fast as the MERT method.
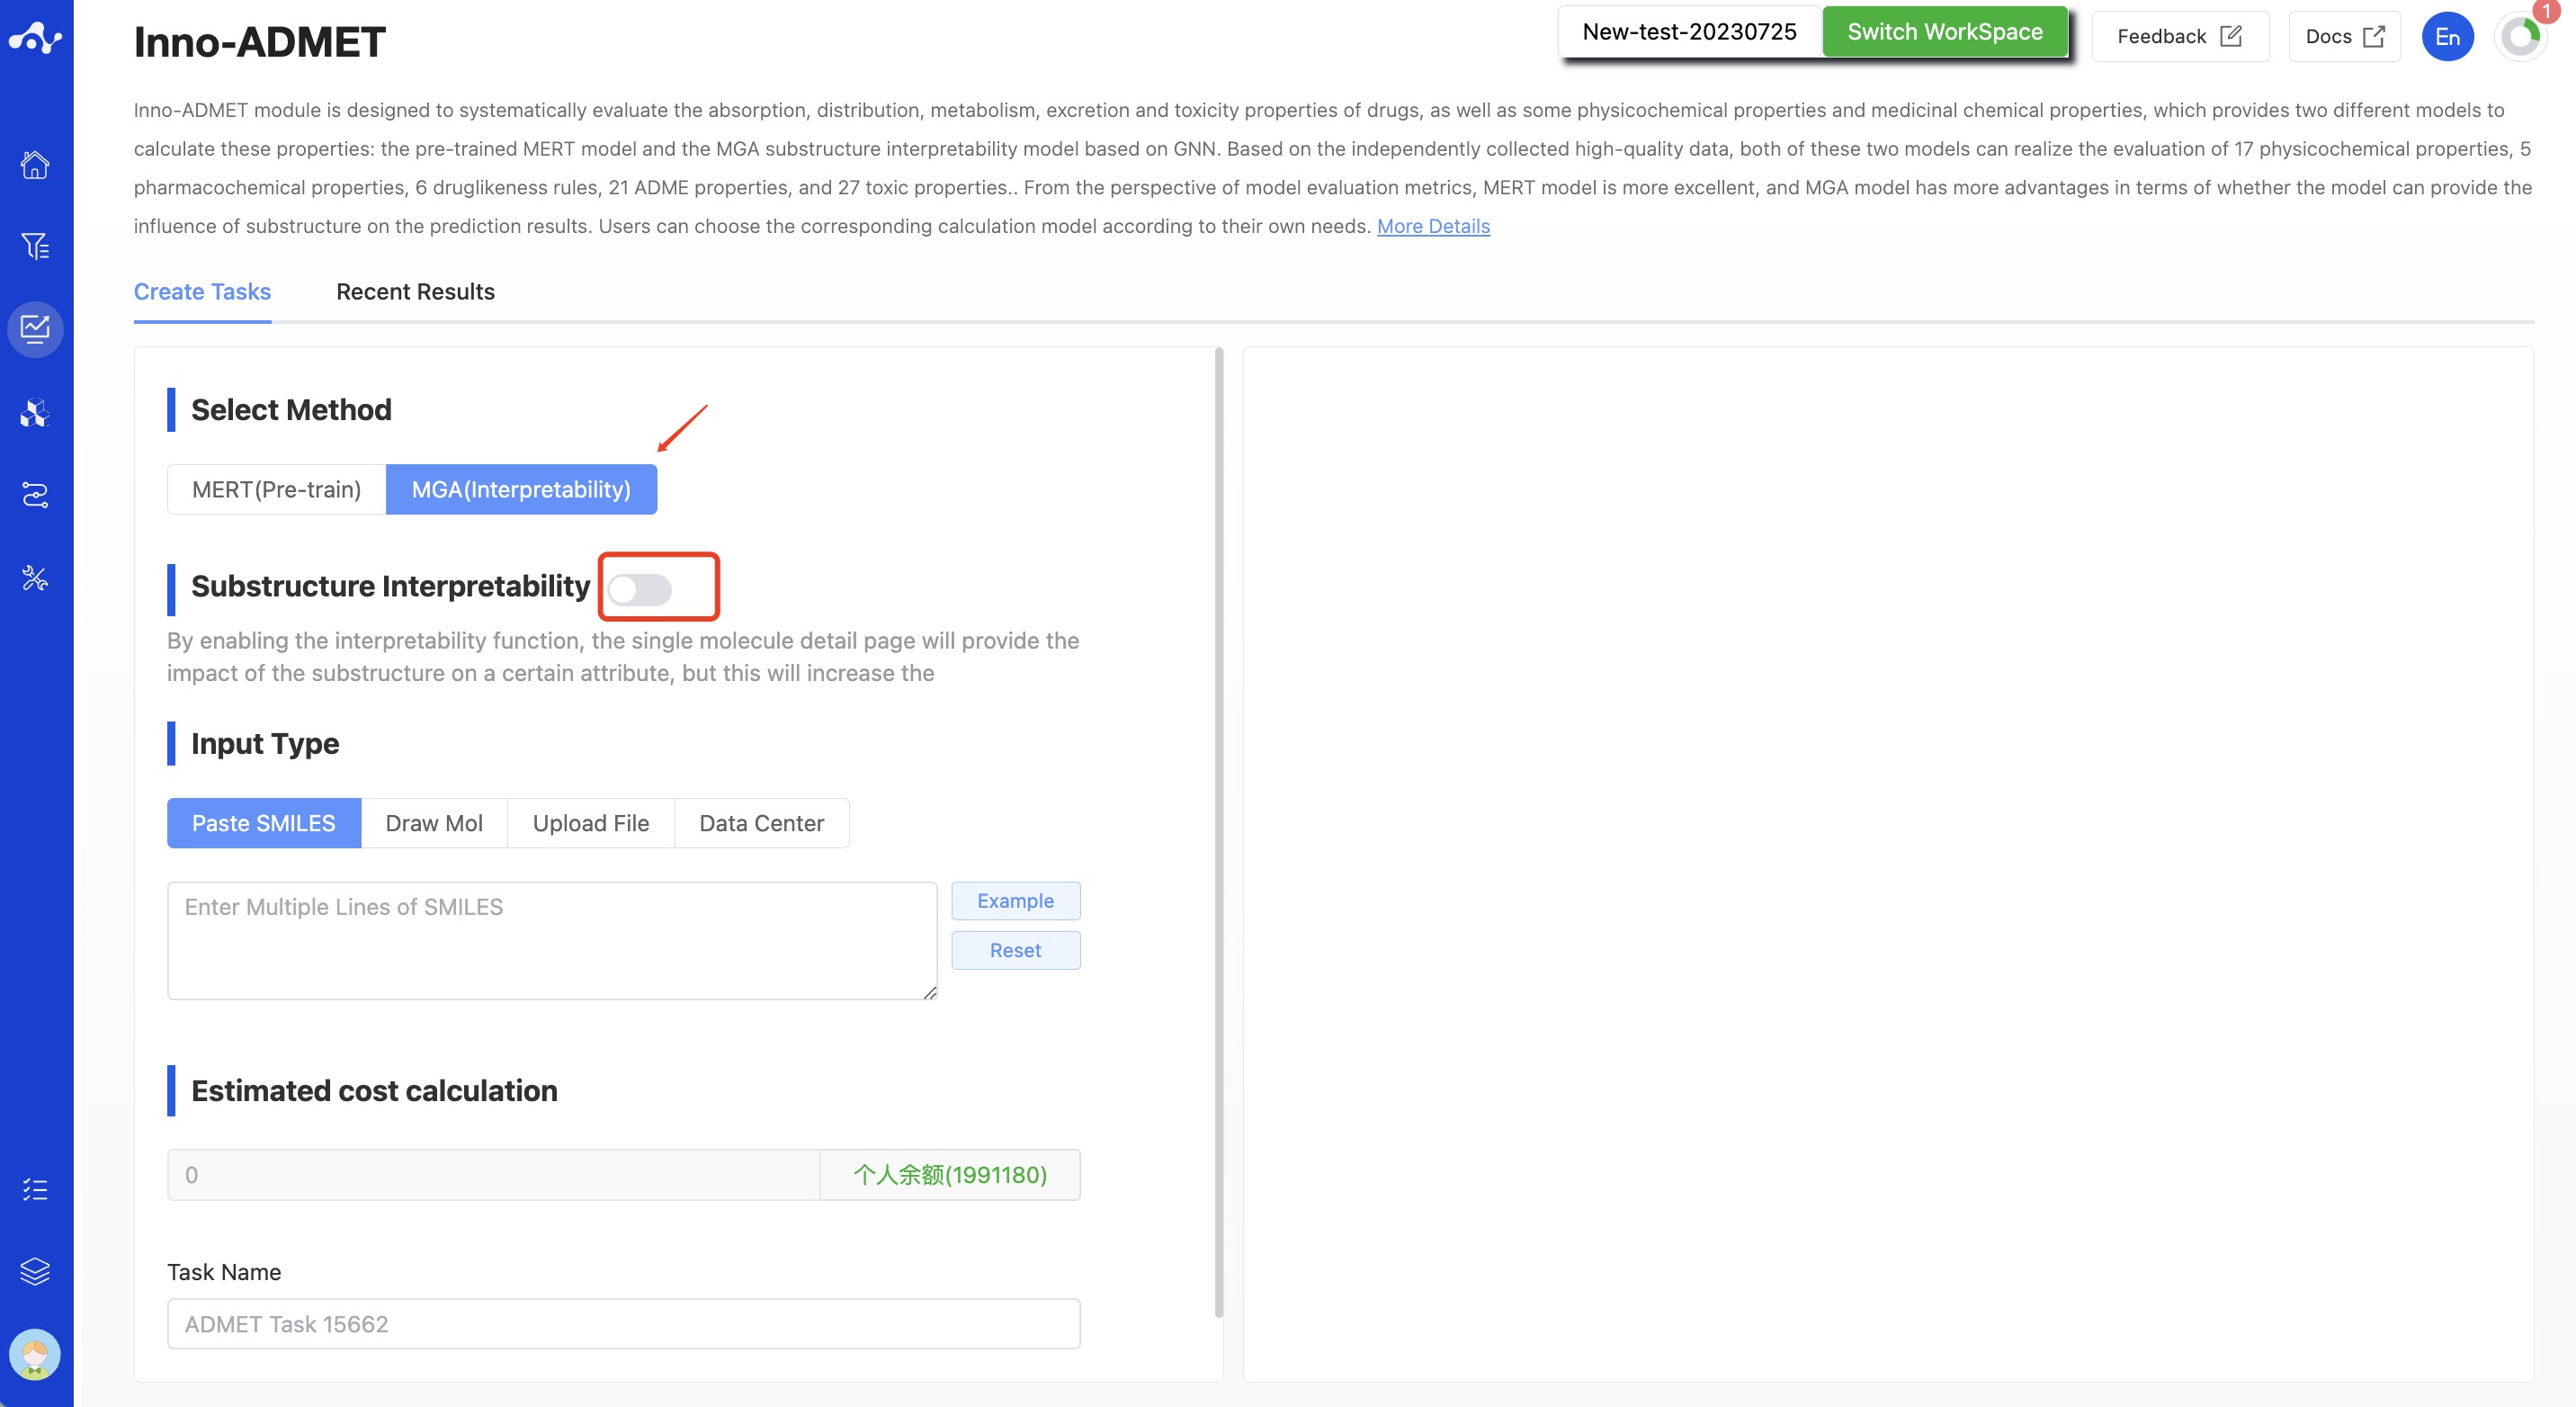
Figure 2. Create Inno-ADMET Task Page — MGA Model
(2) Input Type
The platform provides four data input methods: paste SMILES, draw molecule, upload file, and data center.
- Paste SMILES
Check the box that says "Input SMILES" and then, in the text box, enter one or more SMILES expressions (use line breaks to input multiple SMILES). This text box can contain up to 500 SMILES. If you want to input more than this, you can submit the task by uploading a file.
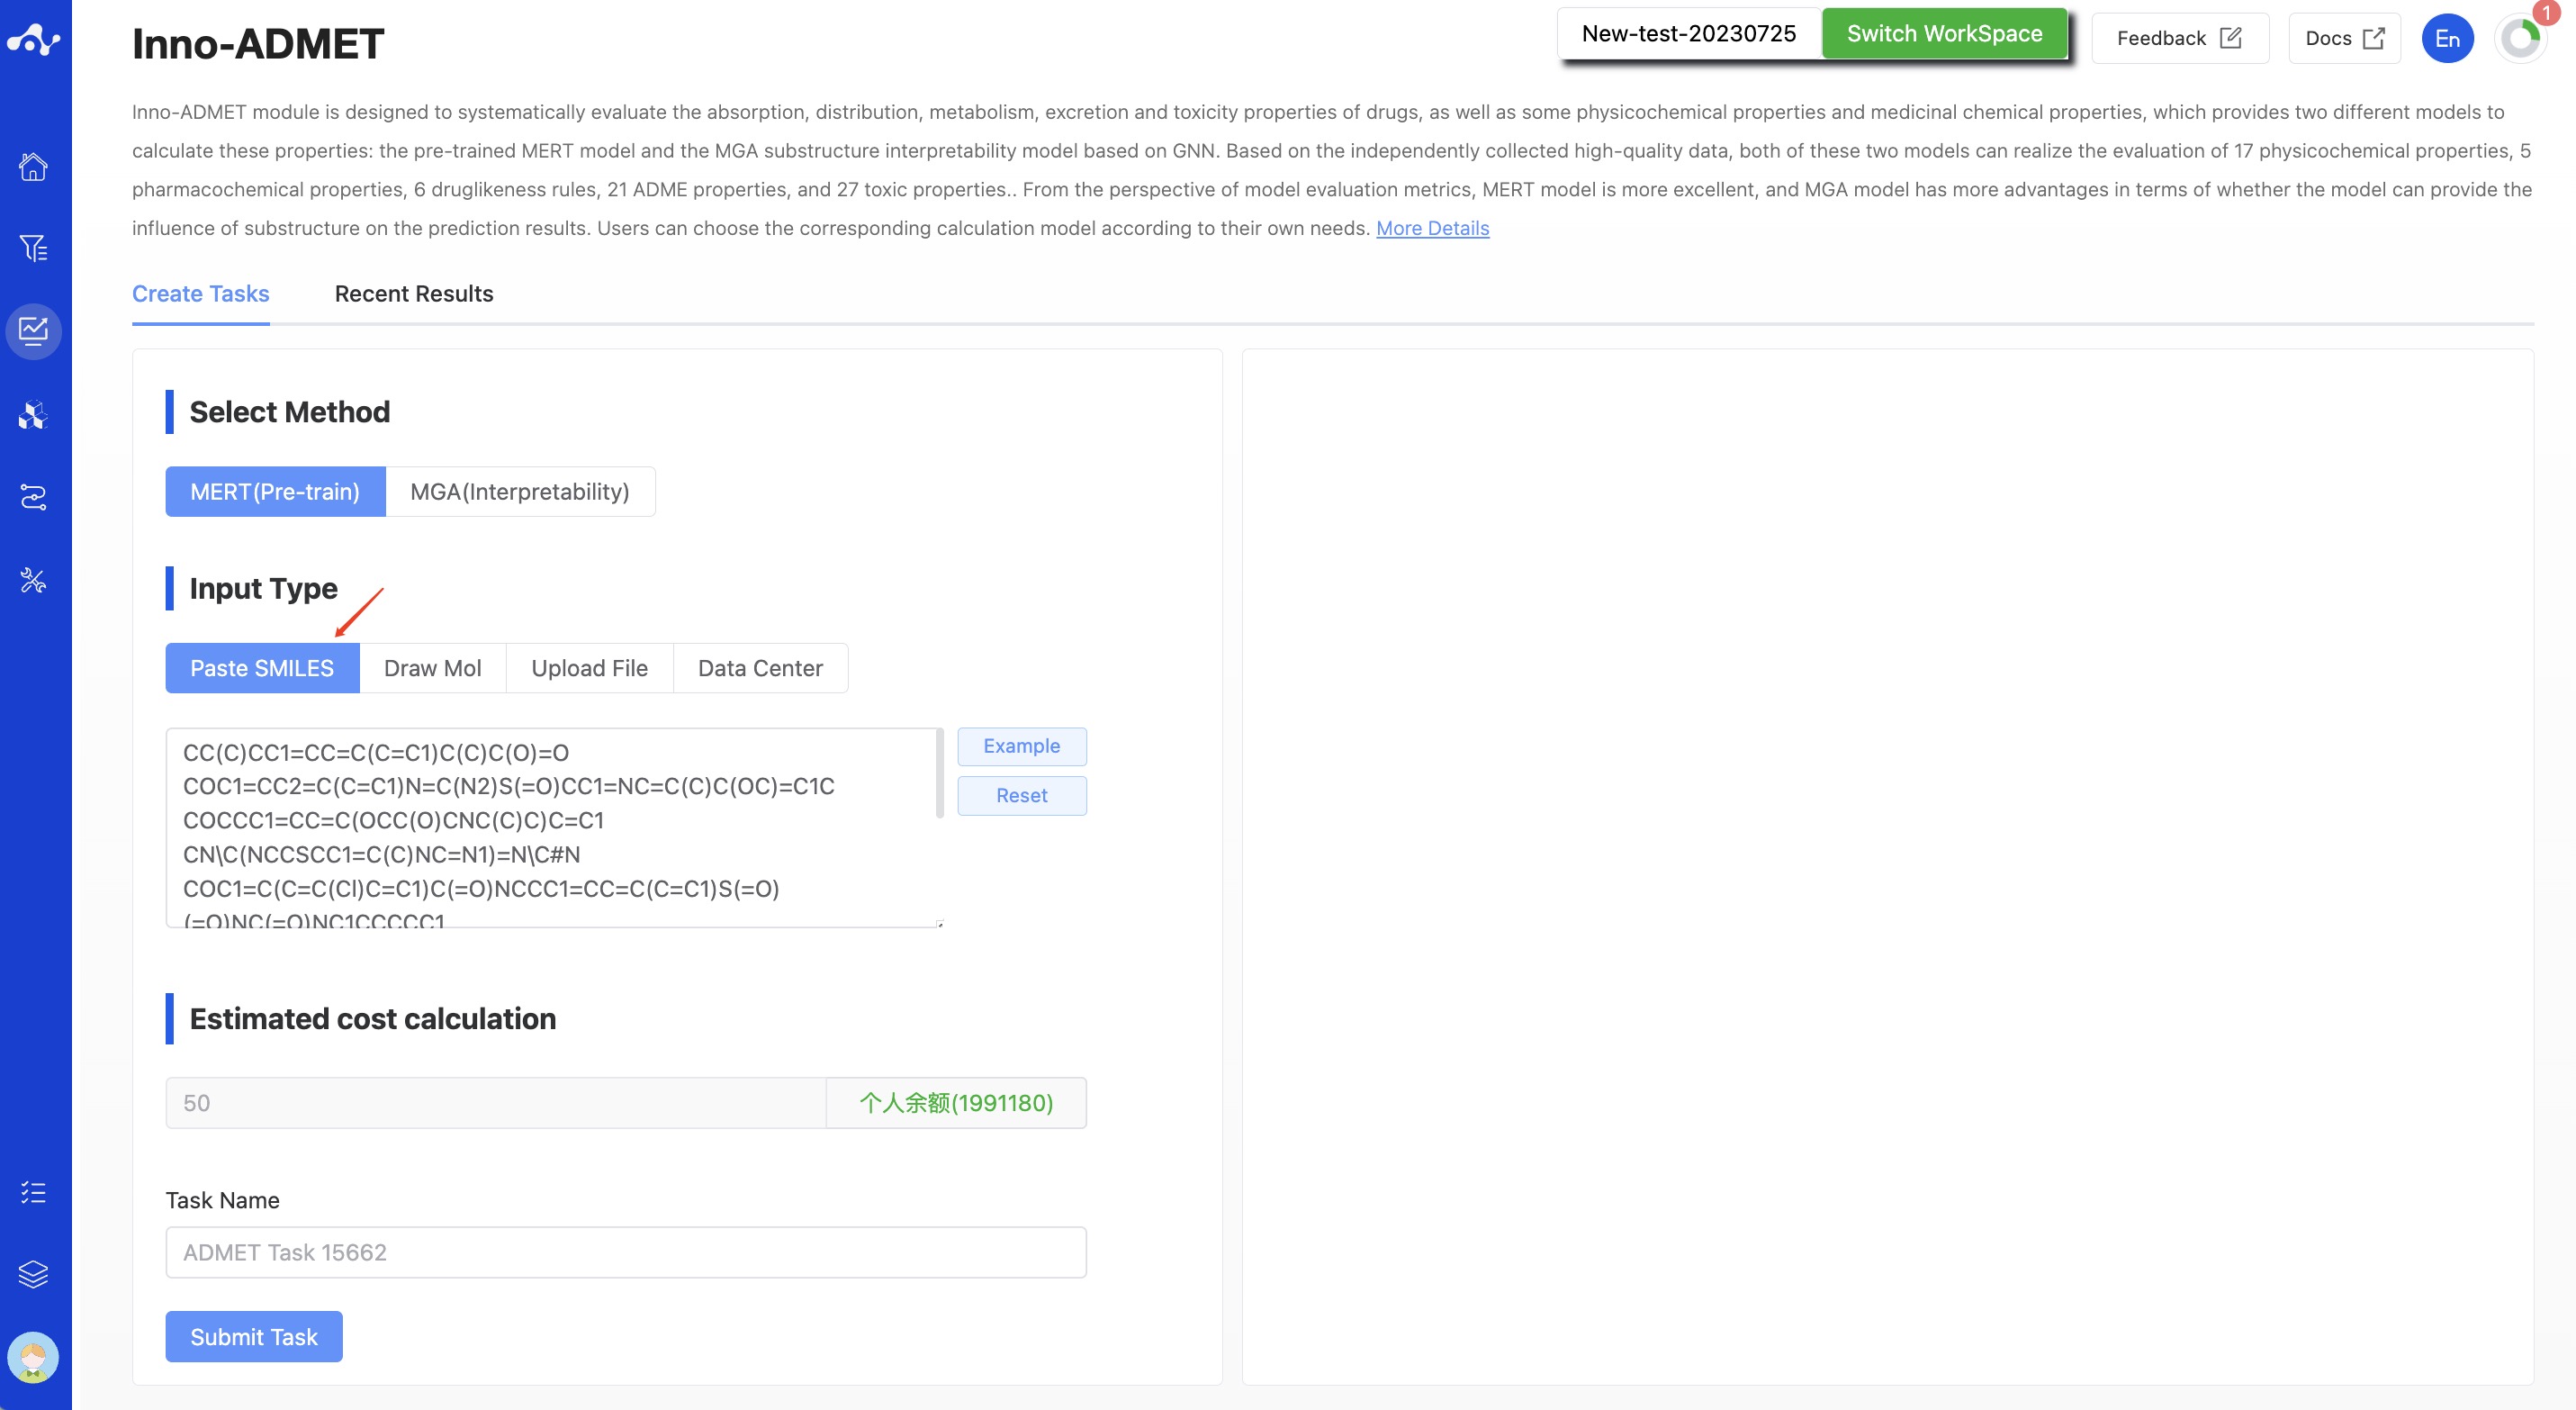
Figure 3. Input Type—— Paste SMILES
- Draw Molecule
Select "Drawing Molecules" in the check box and draw the molecular structure in the editor, and only one molecule can be drawn.
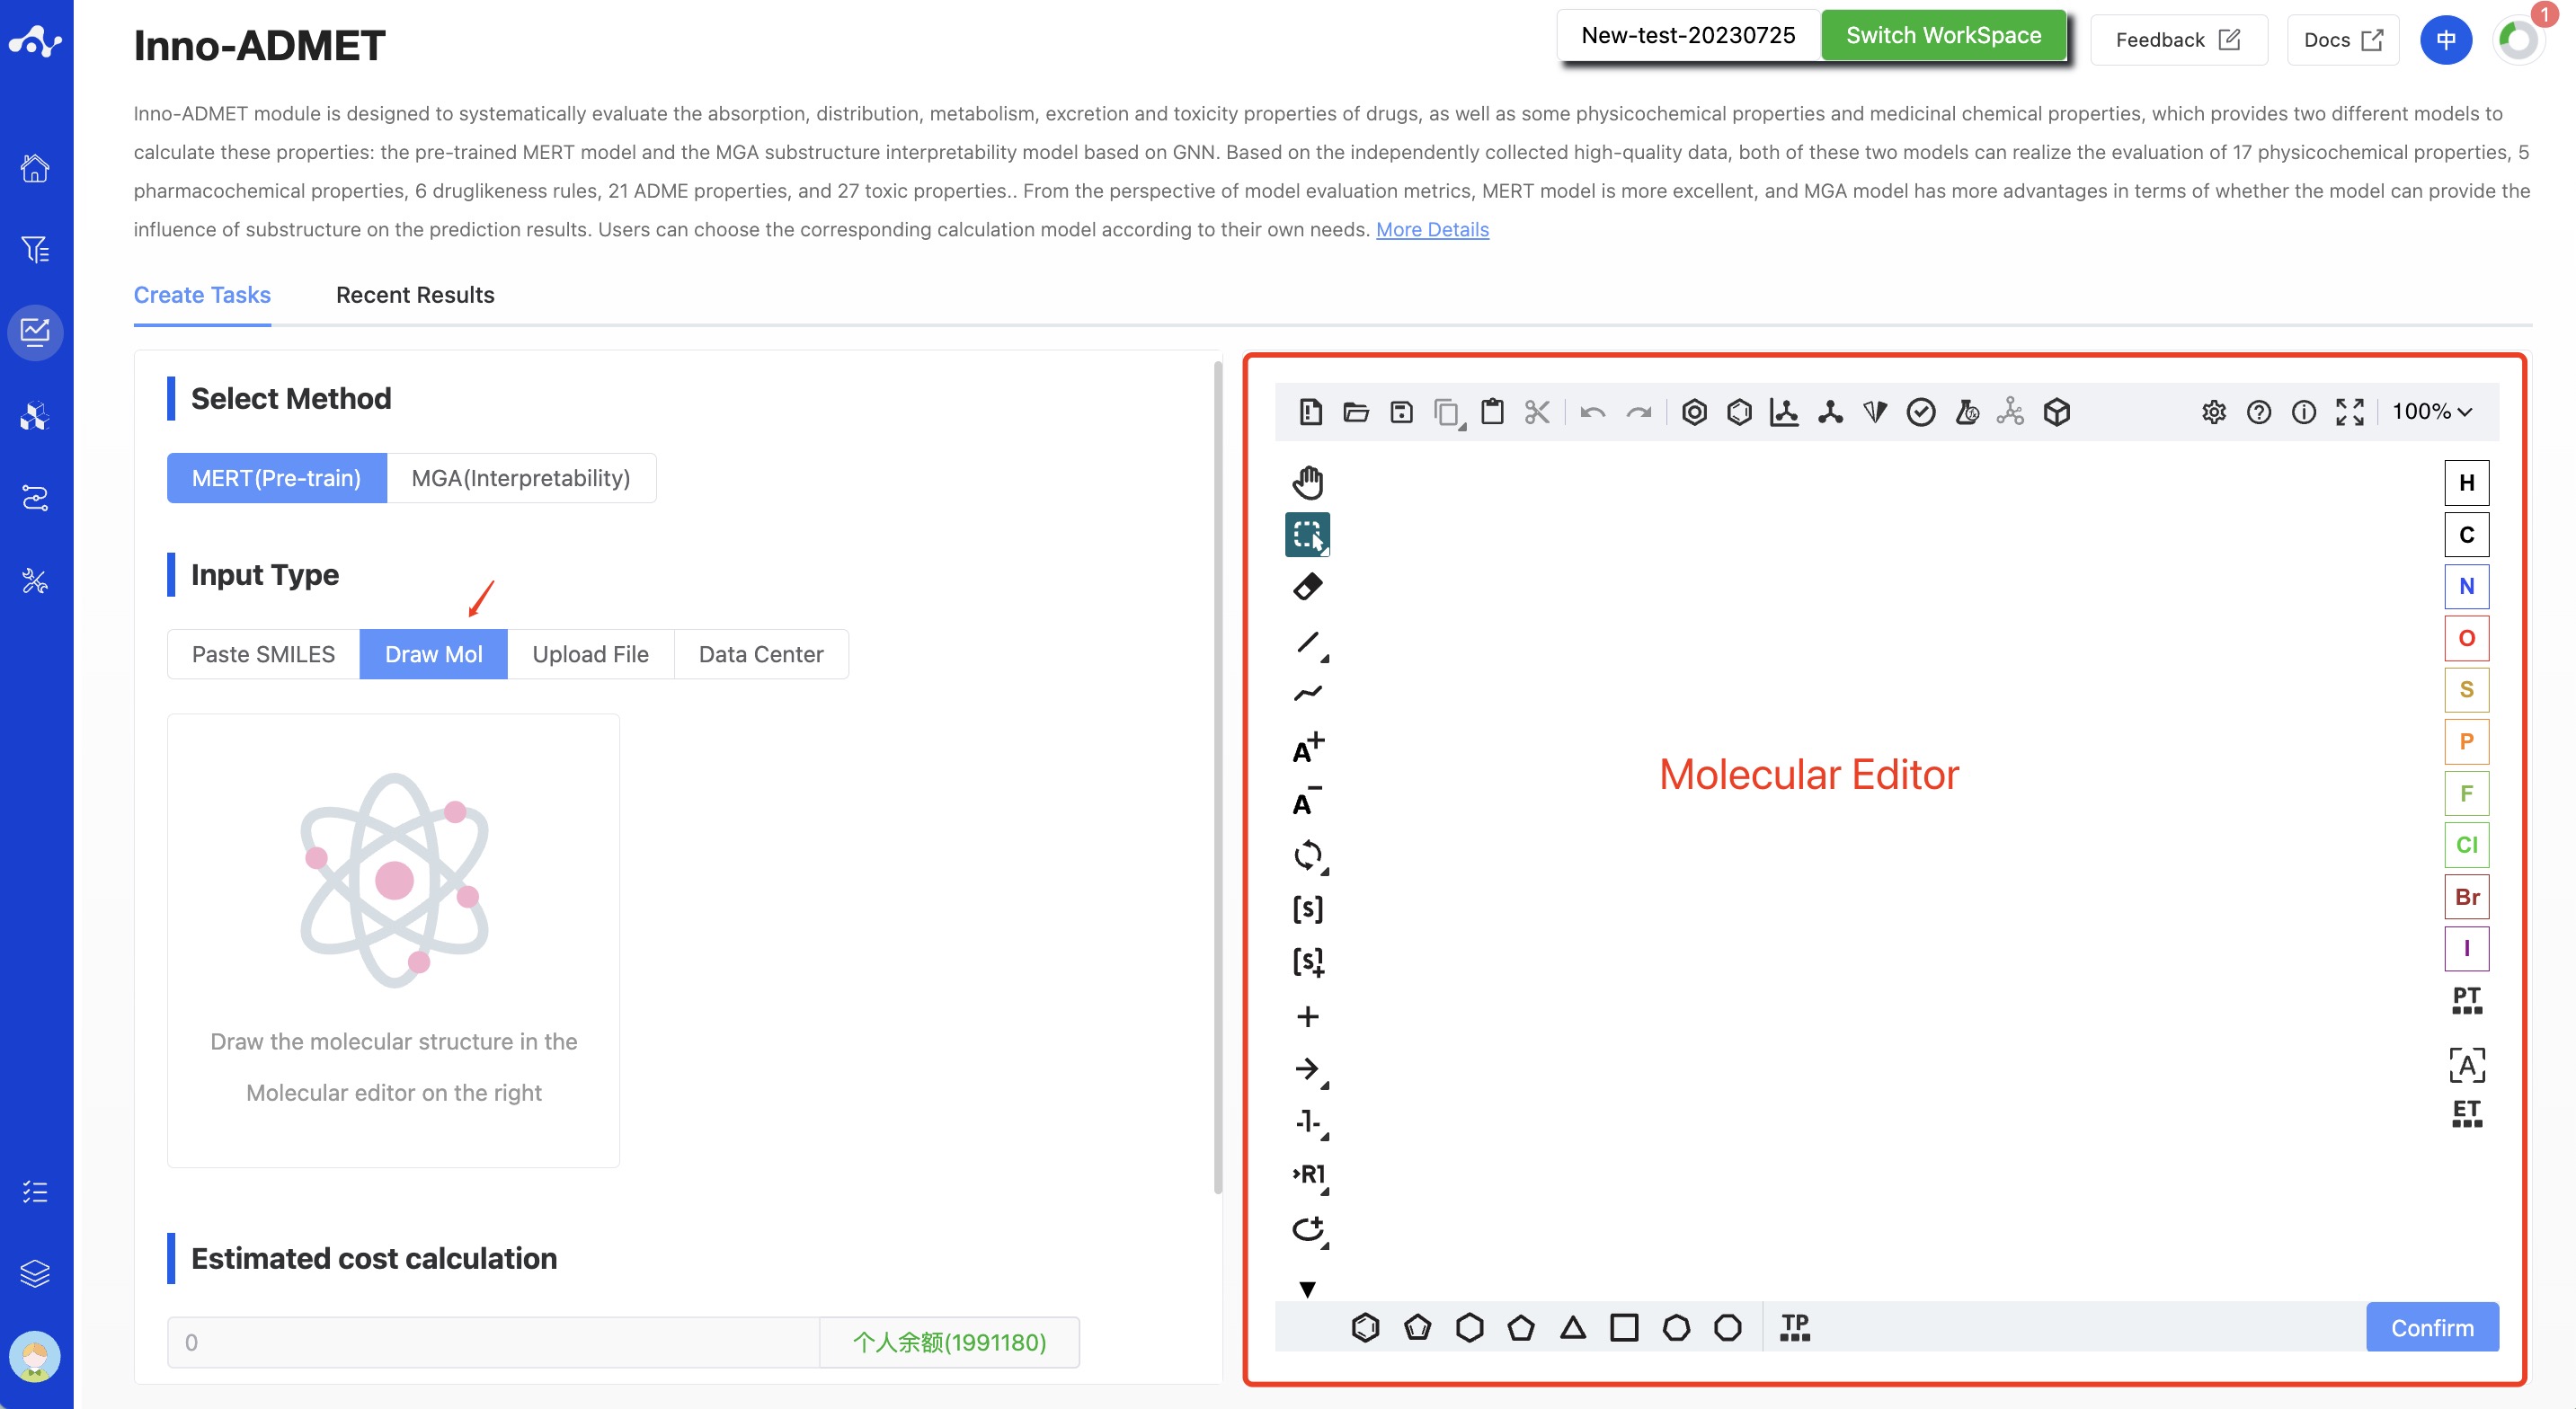
Figure 4. Input Type —— Draw Molecule
- Upload File
Check the "Upload File" box, and you can select a local file by clicking the button below. After the file is selected, the file name will be displayed on the button, and the file content will be displayed on the right. Regarding the uploaded files:
The currently supported file formats are .sdf and .csv. If an sdf file is uploaded, the task can be directly submitted. If a csv file is uploaded, you need to specify the smiles column before the task can be submitted.
The file size should not exceed 10MB.
- Data Center
Check the "Data Center" box, and a pop-up window will appear when you click the button below. Click on the file name to select data from the data center. After you click, the pop-up window will disappear and you can submit the task.
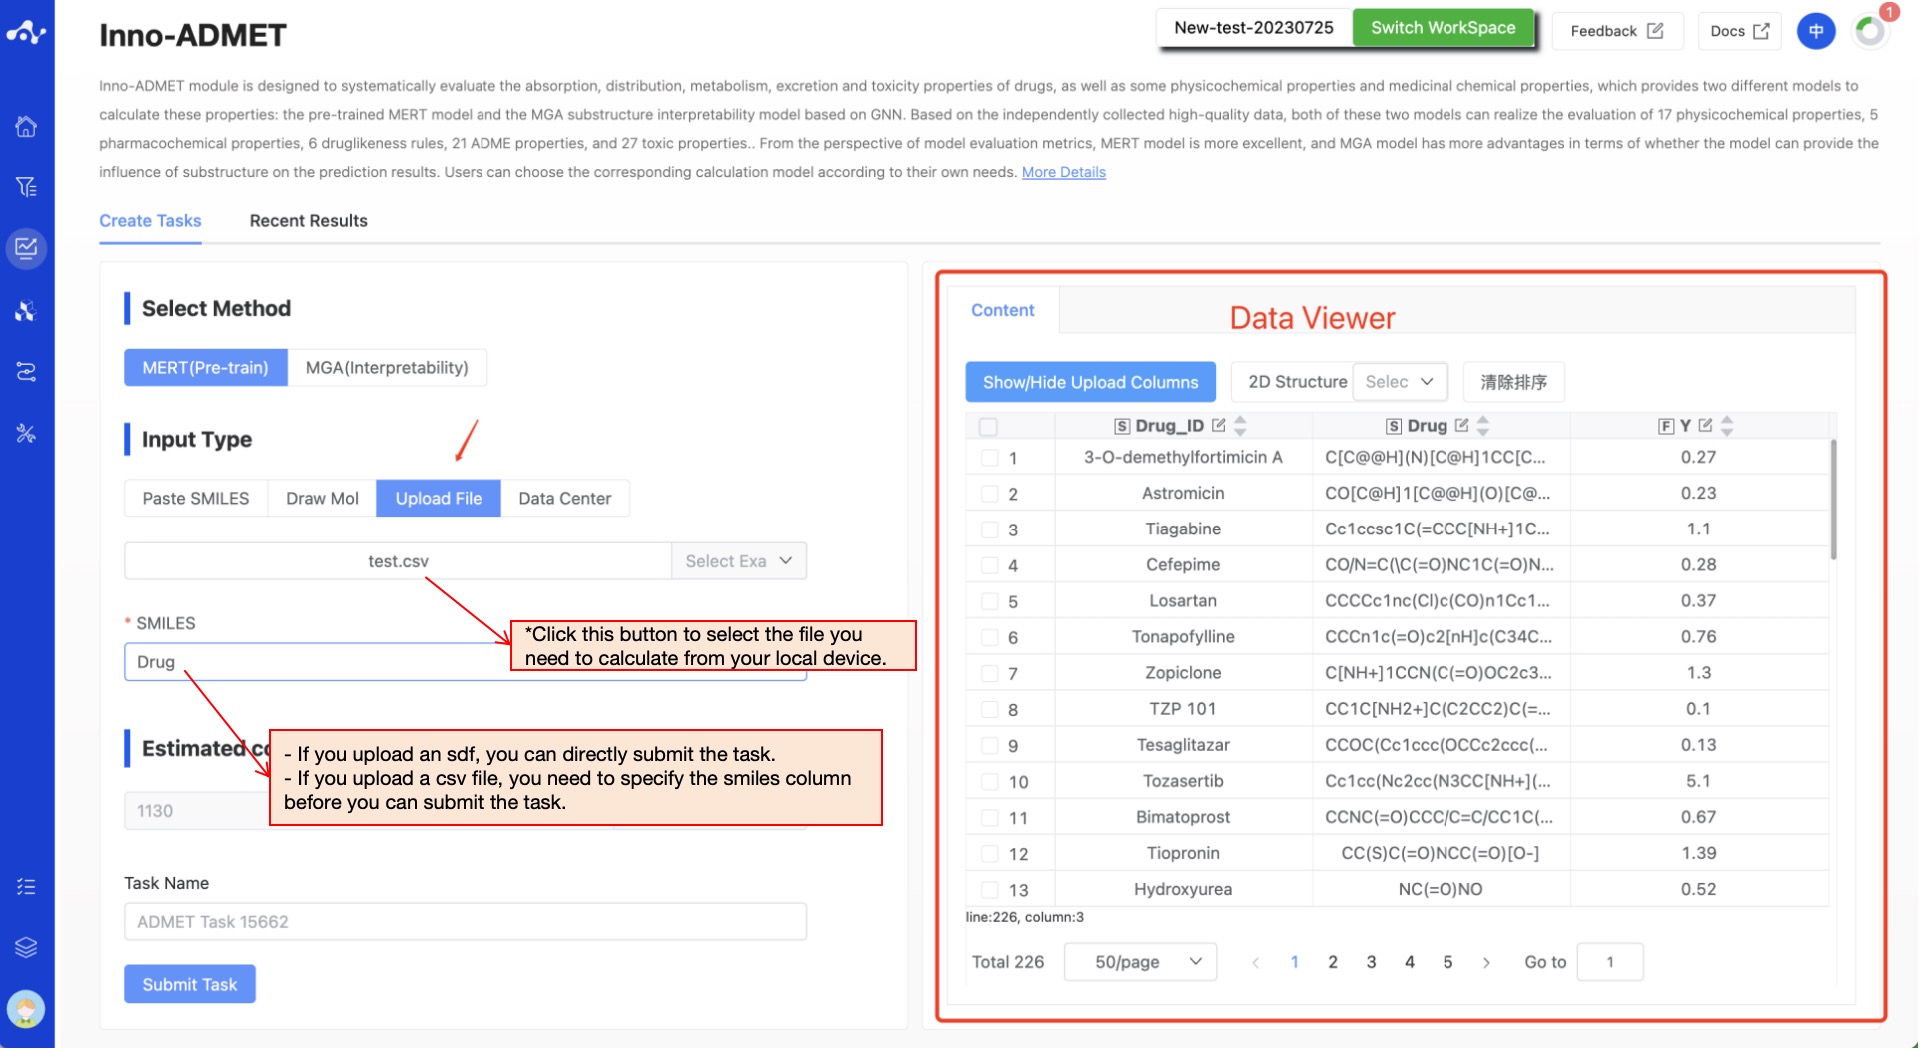
Figure 5. Input method——Upload File/Data Center
(3) Running Sataus and View Results
After the task is submitted, the page will automatically jump to the "Recent Results" subpage of the current page. Here you can view the task running status of the current module (progress bar), and you can also view all running tasks of all modules in the "Running" dropdown box in the upper right corner. When the data volume is large, the system will calculate in batches, so as long as a batch of data is calculated (while the entire task is still running), you can click the "Result Details" button to enter the result page and view the prediction result list of the currently completed calculations (molecules that have not completed the calculation will not be displayed temporarily). You can also refresh the current page to get the latest completed data.
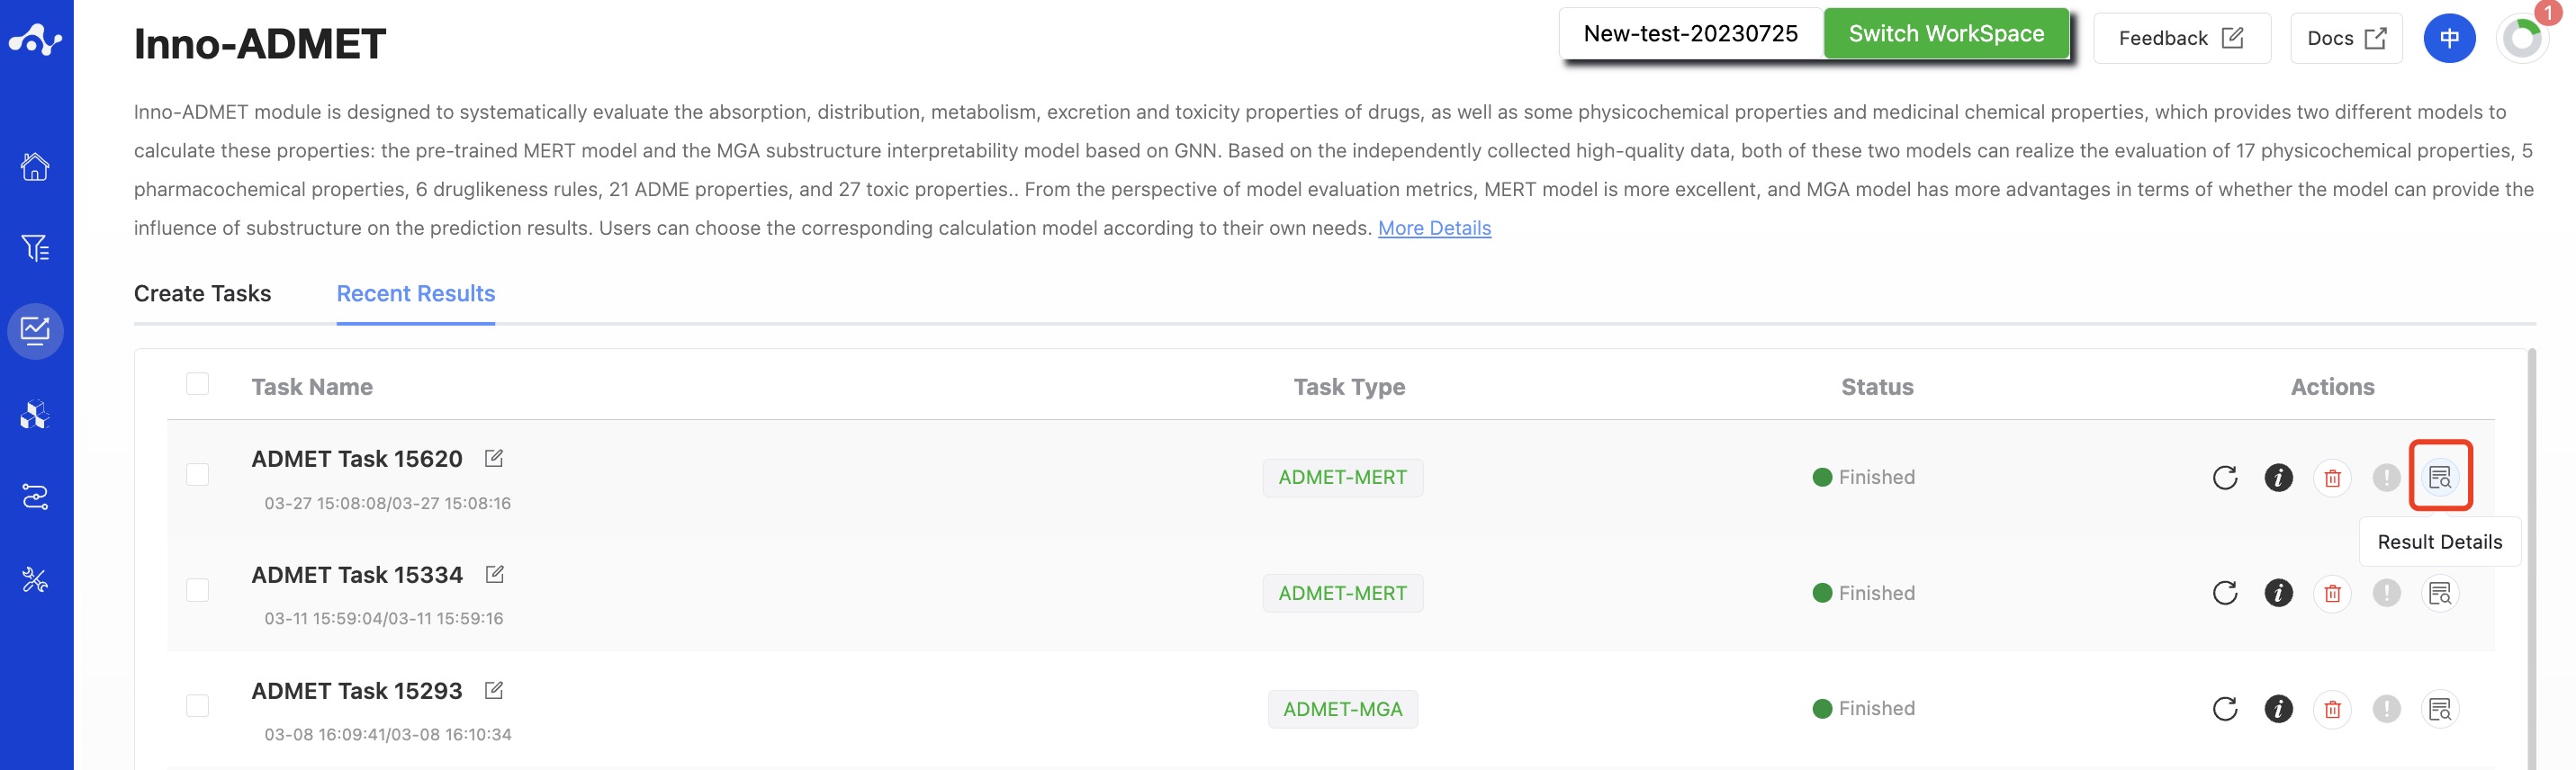
Figure 6. View Results
3. Results Analysis
The results page consists of a Summary at the top, a Filter area on the left, and a Results Details area in the center. By default, the Results Details area displays the results list (you can also switch to card subpages), where you can view all the predicted properties and sort and filter these properties. Meanwhile, to facilitate users to intuitively analyze the data, we have assigned a color to the predicted results.
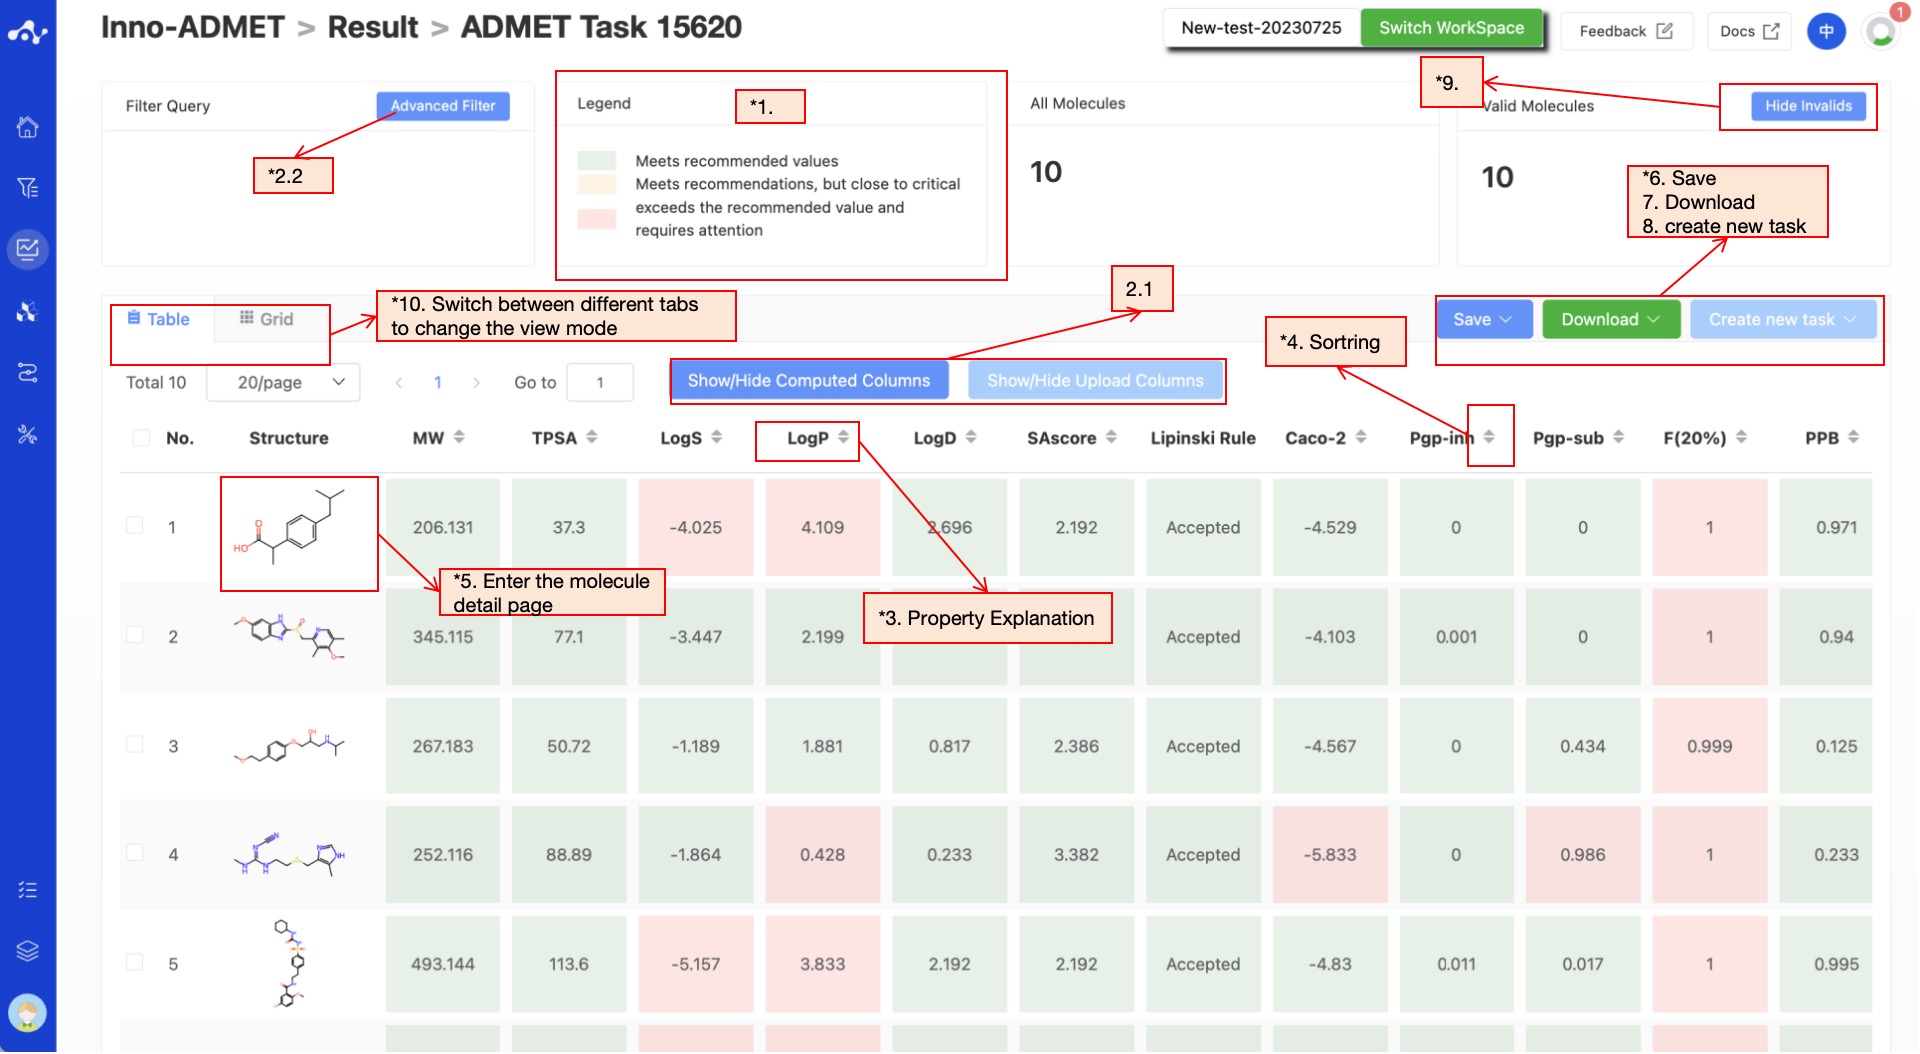
Figure 7. Results Page Function Distribution
(1) Definition of Color
Since different properties have different suggested value ranges, we made an intuitive evaluation of the prediction results by color. The rules for color setting are as follows:
- For properties where the predicted result is between 0-1:
P≤0.5, the background color of the value is green, which means that the predicted compound does not belong to this category;
05<P<0.7, the background color of the value is yellow, indicating that the predicted compound may belong to this category;
P≥0.7, the background color of the value is red, indicating that the predicted compound is likely to be this category.
- For properties with optimal intervals, such as:
The optimal value of Fsp3 is Fsp3 ≥ 0.42, and two colors are defined, those that meet the threshold are green, and those that do not meet the threshold are red;
The optimal interval of Log S is -4~0.5, and two colors are defined, those within the interval are green, and those beyond the interval are red;
There are three definitions for the value of QED: Attractive: > 0.67; unattractive: 0.49-0.67; too complex: < 0.34, according to this definition, red, green and yellow can be assigned.
Through the above color distinction, you can understand the overall evaluation results of molecules more intuitively. The more green background, the better the ADMET properties of the molecule, and vice versa.
(2) Filter
The platform provides general filter and advanced filter to meet the needs of users.
- General filter
General filters can show/hide properties. The default result list shows all the computed properties, and the control column on the left is in the selected state. When you do not want to display the property, just uncheck the property, and the result list on the left will be displayed in real time according to the selection in the control bar. Two shortcut keys "Select All" and "Select None" are also provided at the top, which is convenient for users to quickly select.
- Advanced filter
On the basis of general filter, advanced filter provides range screening, which can further screen out molecules within a specified range of a property to exclude molecules that do not meet the expected results.
(3) Attribute Interpretation
Hover your mouse over the name of each property to see the corresponding explanation.
(4) Sorting
Click the property name in the result list to re-sort, such as F(20%), click once to ascending order, click again to descending order, click again to restore the original sort.
(5) Molecule Detail Page
When you want to view all properties of a certain molecule, you can click on the molecular structure in the result list to enter the molecule details page.

Figure 8. Molecule Detail Page - MERT Model
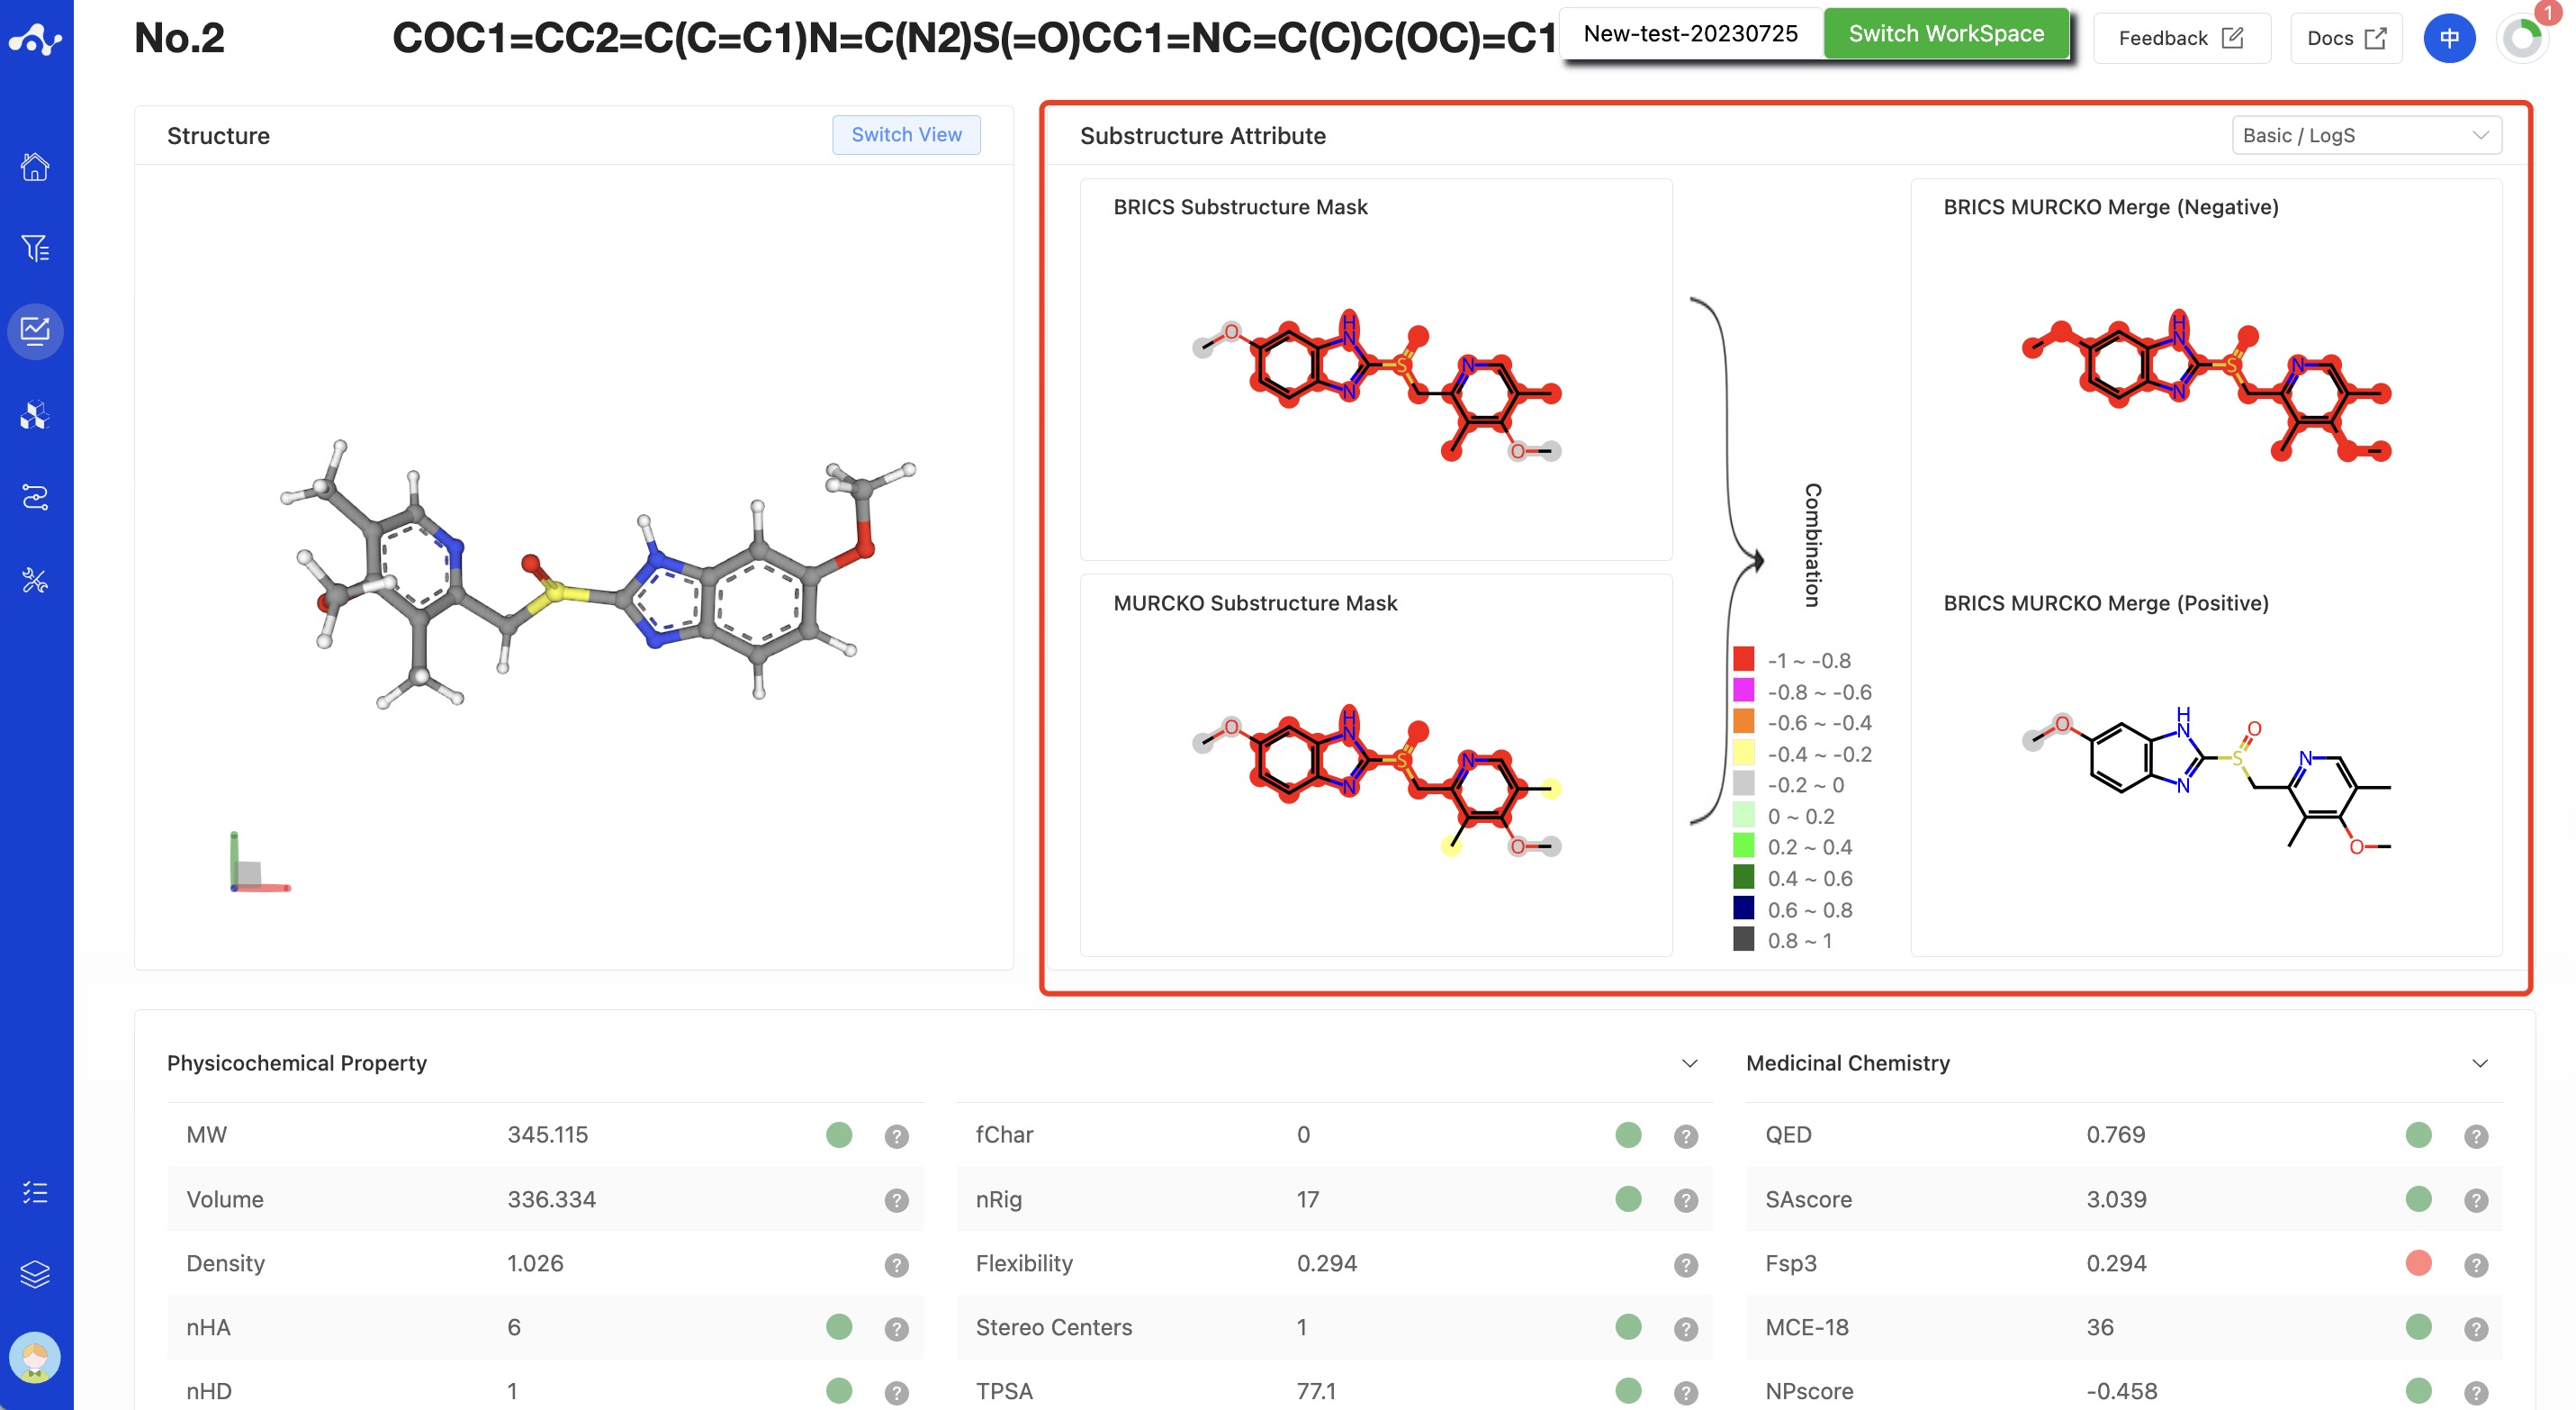
Figure 9. Molecule Detail Page - MGA Model (with substructure interpretability calculated)
(6) Save
Click "Save", and the system will pop up a dropdown box for you to choose the file format to save (currently only supports .csv/.sdf). Once you have determined the style of the file to save, save the corresponding data to the data center as a sdf or csv file. The saved content is the molecules of the effective number displayed on the page, which are usually obtained according to your show/hide column conditions, advanced filtering conditions, favorites, or dislikes.
(7) Download
Click "Download", and the system will pop up a dropdown box for you to choose the file format to download (currently only supports .csv/.sdf). After determining the style of the file to download, the system will download the corresponding data to your local device as a sdf or csv file. The content downloaded is consistent with the save method, which also downloads the molecules of the effective number displayed on the page, which are usually obtained based on your show/hide column conditions, advanced filtering conditions, favorites, or dislikes.
(8) Create New Task
The prerequisite for creating a new task is to first save the data into a file. Before the save operation is performed, this button is disabled. As soon as the new file is saved based on the results, this button is enabled. When you click this button, the system will pop up a dropdown box for you to select the module to be calculated. After clicking, the page will immediately open a new tab and will take your saved dataset with it. After adjusting the parameters, you can submit a new task.
(9) Hide Invalid Molecules
For SMILES errors or molecules that cannot be resolved in the back-end, the algorithm cannot perform the correct calculation, in which case the task is unaffected, but the molecule is defined as invalid. Users can use the "Hide invalid molecules" button to quickly filter out the part of the molecule.
(10) Card Subpage
In the card page, we provide a more concise way to view the results, you can only see the structure of the molecule and its 3 basic properties: MW, SA and QED.
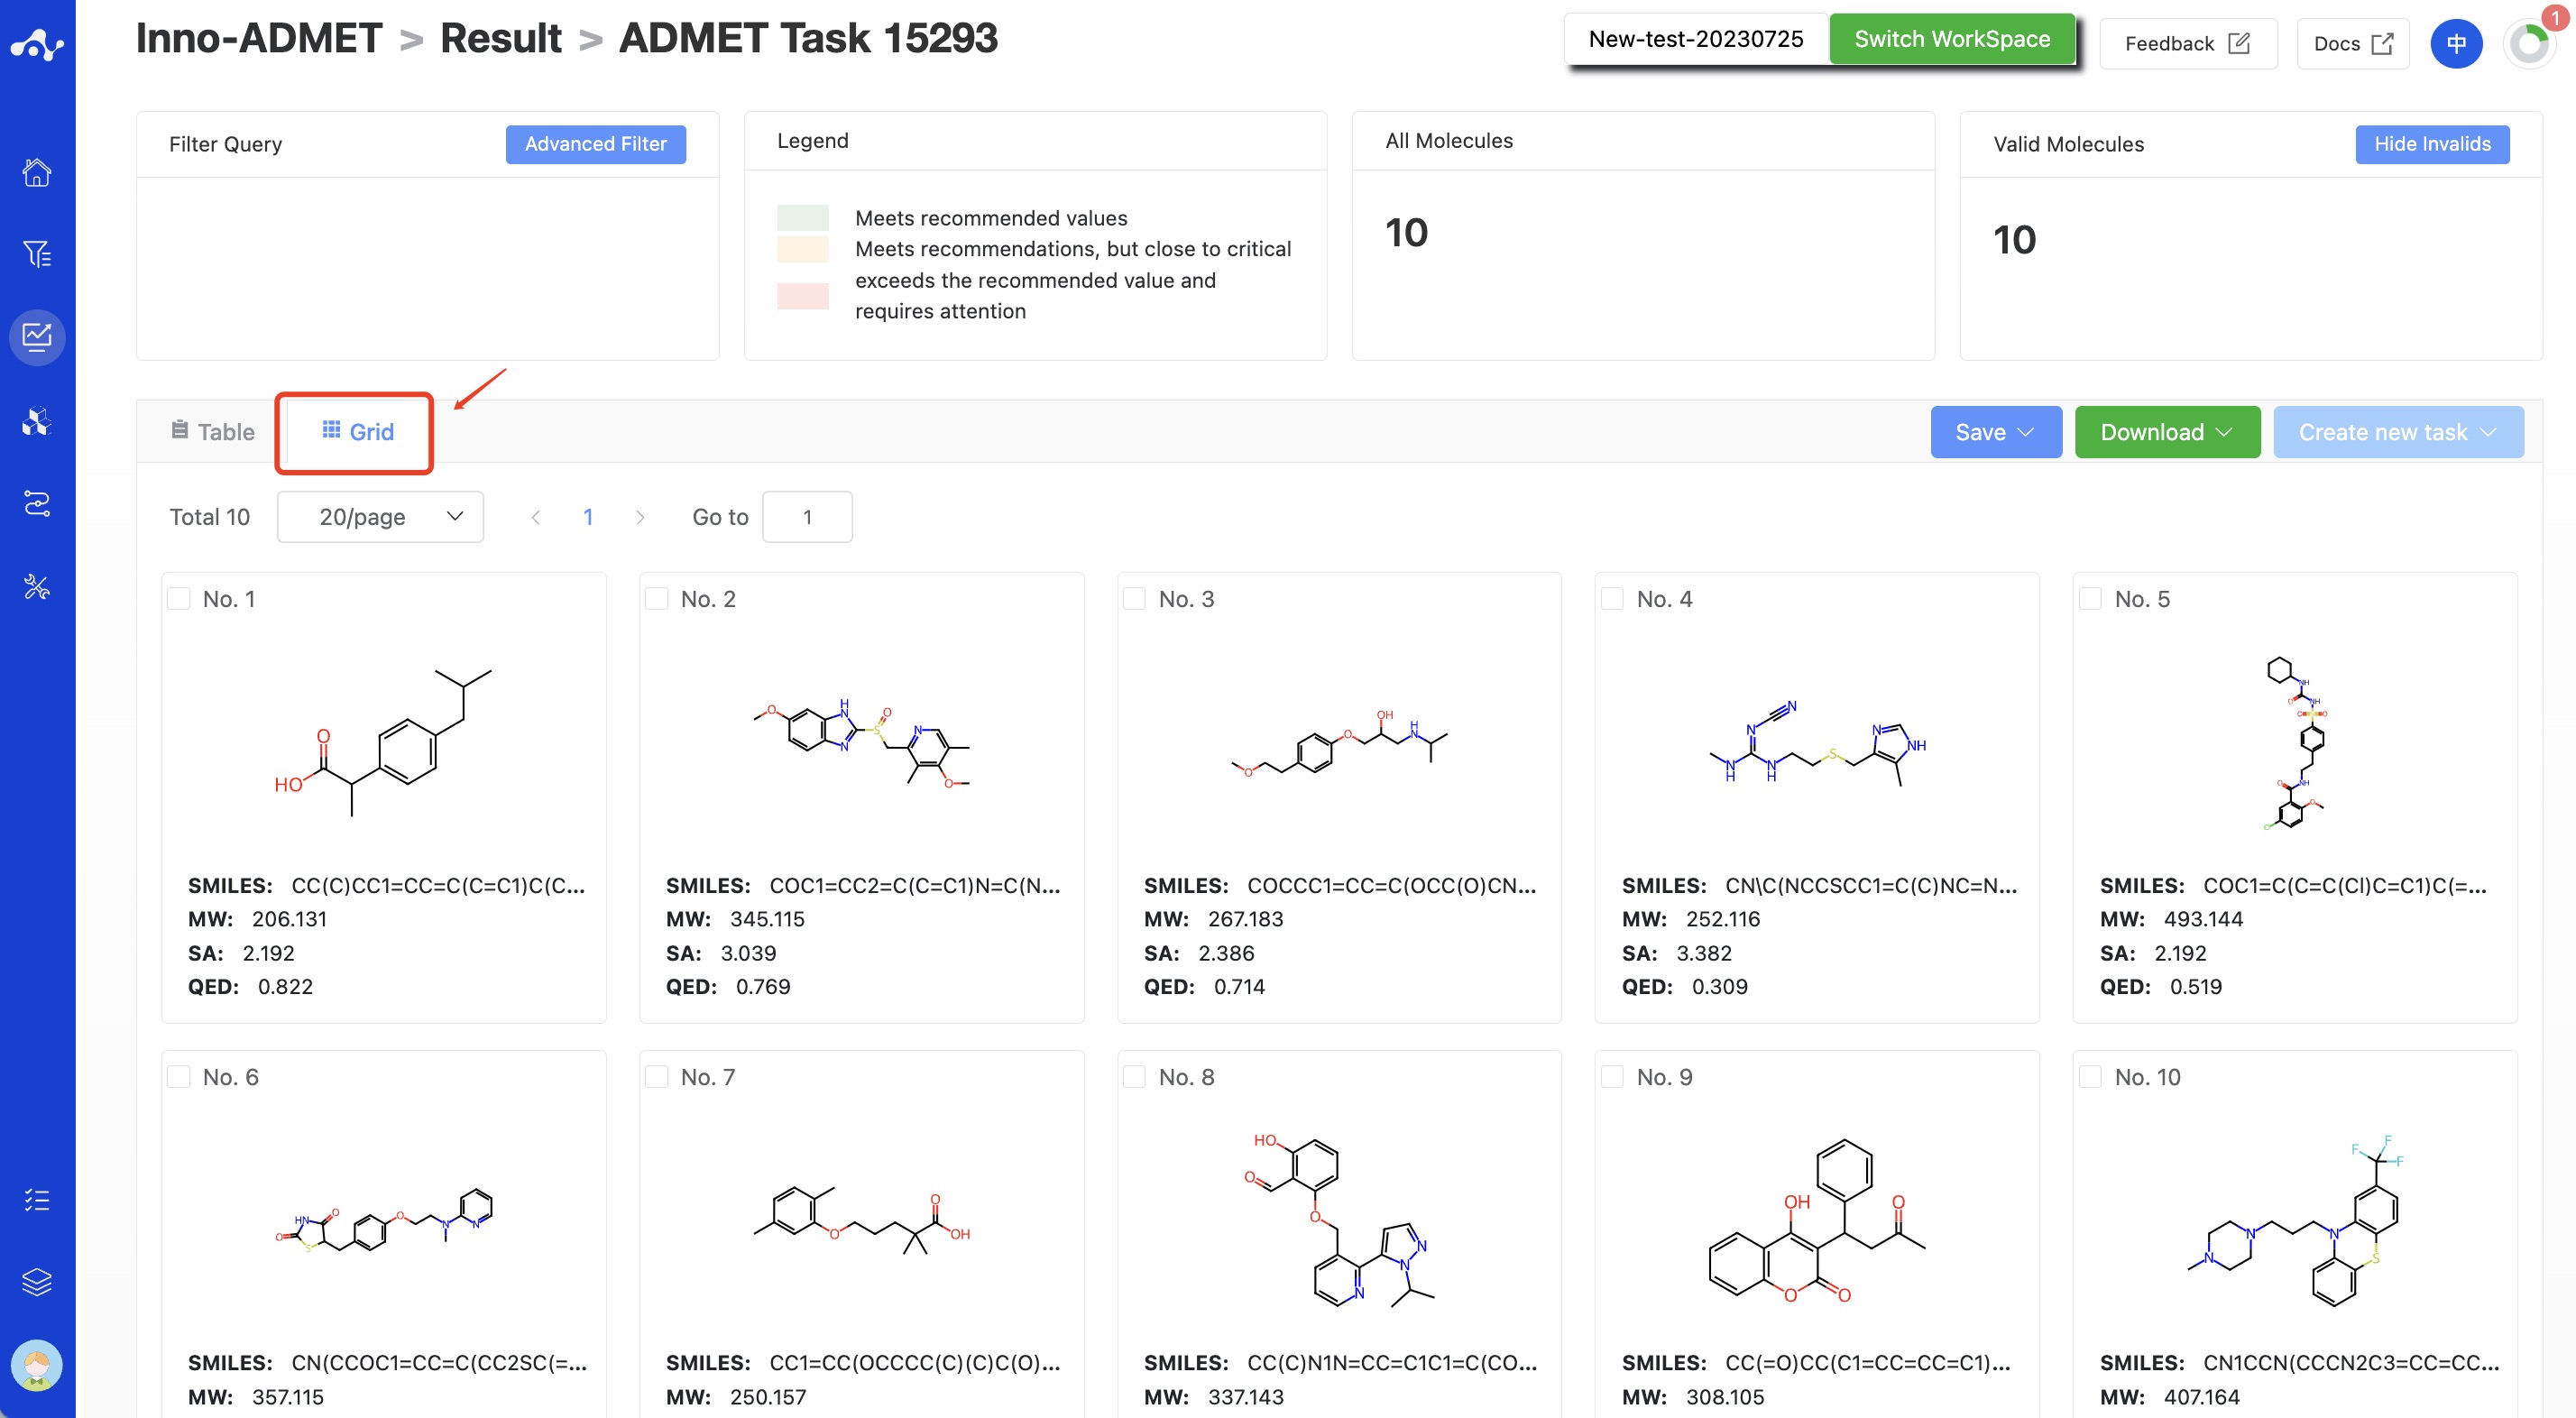
Figure 10. The result of grid page.
4. Introduction to the Related Algorithm
The system offers two different models to compute drug-like properties, namely the pre-trained MERT model and the GNN substructure interpretability-based MGA model. The modeling frameworks of Inno-ADMET(MERT) and Inno-ADMET(MGA) are shown in Figures 1 and 2.
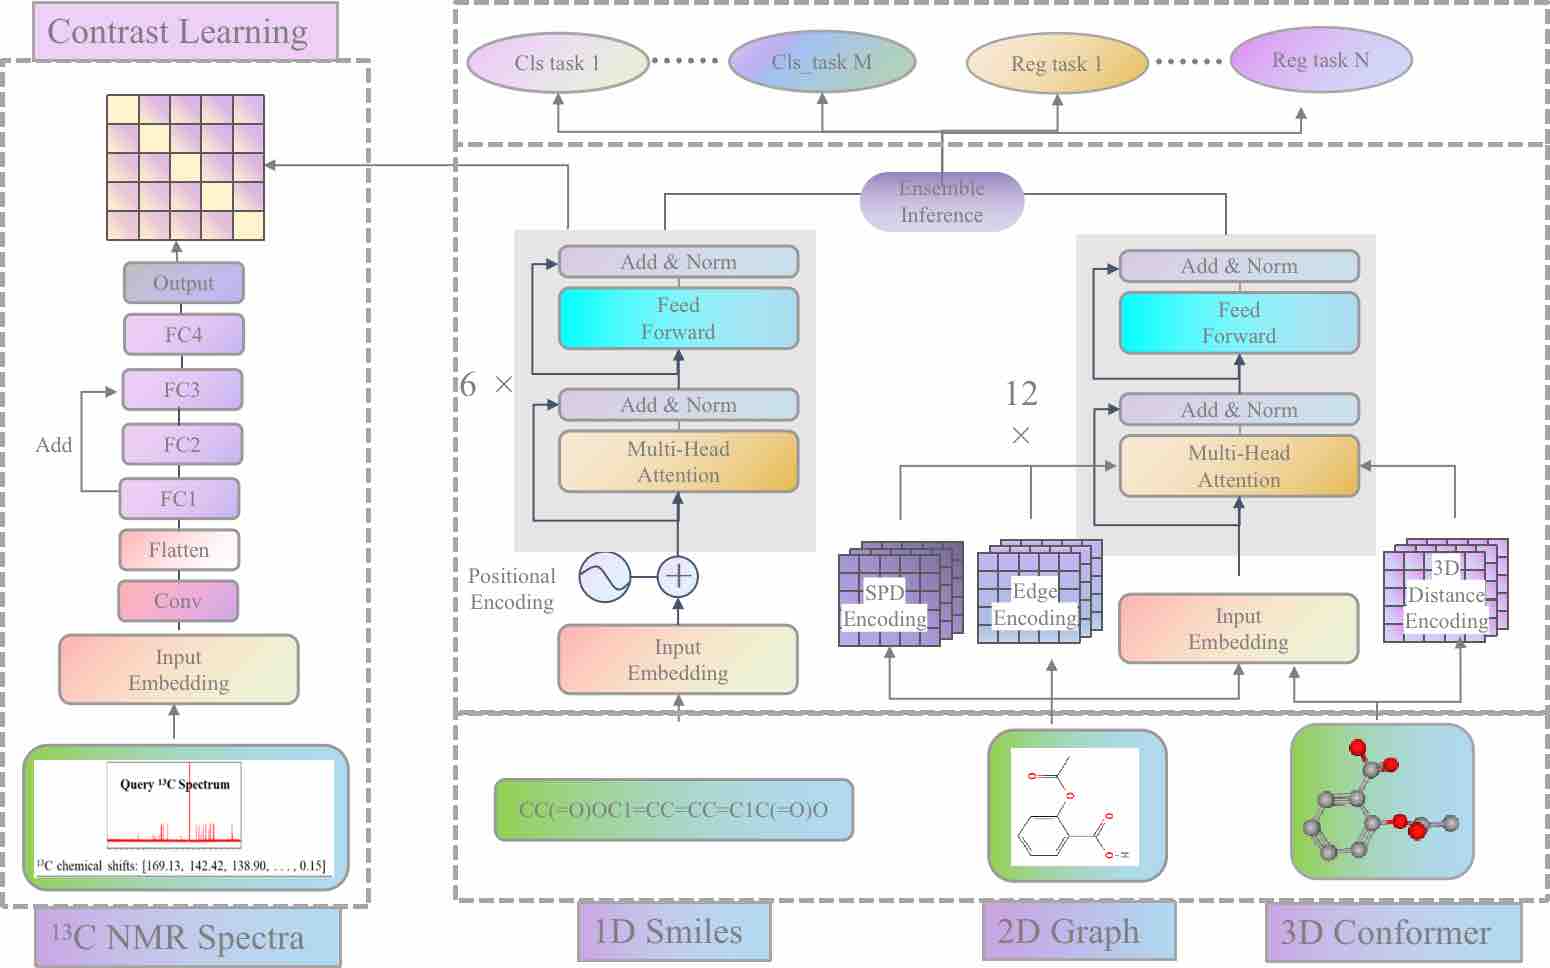
Figure 11. The Inno-ADMET(MERT) modeling framework.
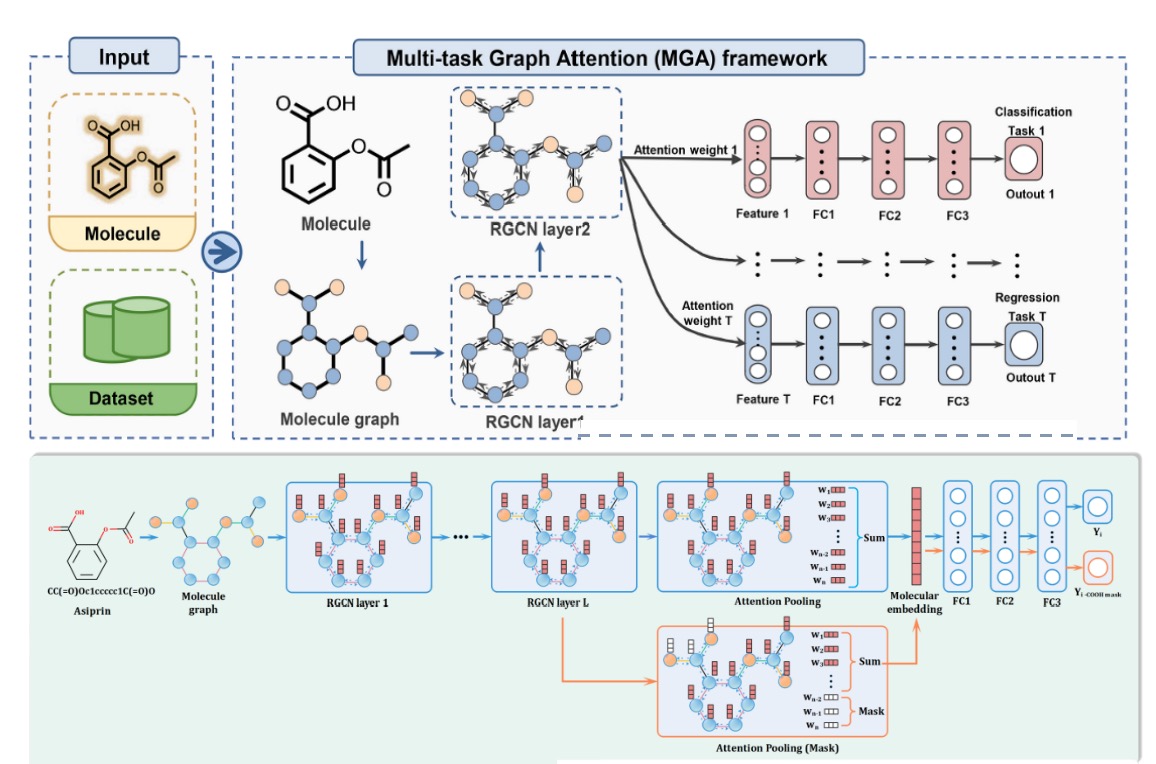
Figure 12. The Inno-ADMET(MGA) modeling framework.
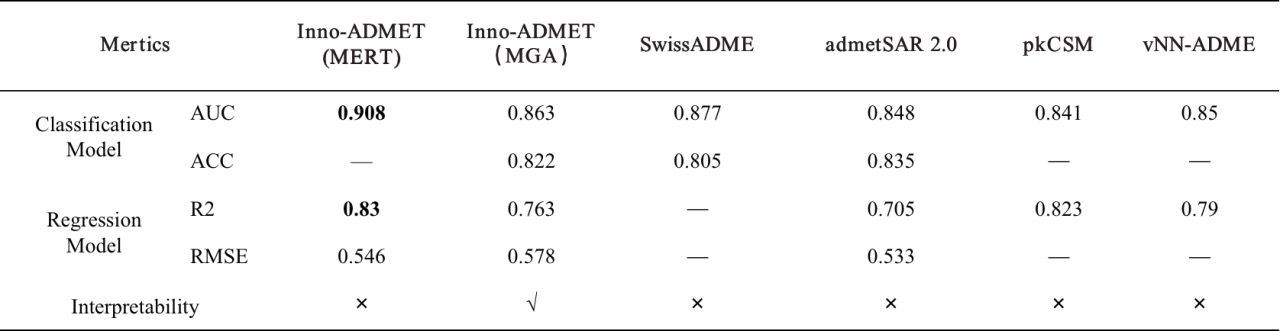
In addition to our ADMET module, the same type of platforms for computing ADMET properties include Swiss-ADME, admetSAR 2.0, FAF-Drugs4, pkCSM and vNN-ADMET. We compare the differences between these platforms in detail, and the detailed information are summarized in Table 1. It is known that these platform tools have their own priorities. For example, Swiss-ADME can provide multiple calculation methods for logP and logS and various drug similarity rules; admetSAR 2.0 includes the most diverse metabolic properties; FAF-Drugs4 is the first attempt to incorporate poison rules into ADMET assessment; while the predictive properties available in vNN-ADME are relatively limited. In contrast, our ADMET module can be used to predict every important aspect of molecular mass, covering the primary endpoint of interest to medicinal chemists. In particular, some toxicity substructure rules, toxicity pathways and some medicinal chemical properties predictions provided by the platform are unique tools. The prediction results of the MERT and MGA models are shown in Table 2. From the perspective of model evaluation metrics, Inno-ADMET (MERT) has a higher accuracy rate than other platforms; in terms of result interpretability, Inno-ADMET (MGA) has the advantage. Additionally, in terms of speed, Inno-ADMET (MERT) is faster than Inno-ADMET (MGA), with Inno-ADMET (MERT) achieving a speed of 2.35ms per molecule.
Table 1. Comparison of main features of ADMET module with other web-based tools. "+" indicates that this feature is supported, and each additional "+" indicates a higher degree of support.
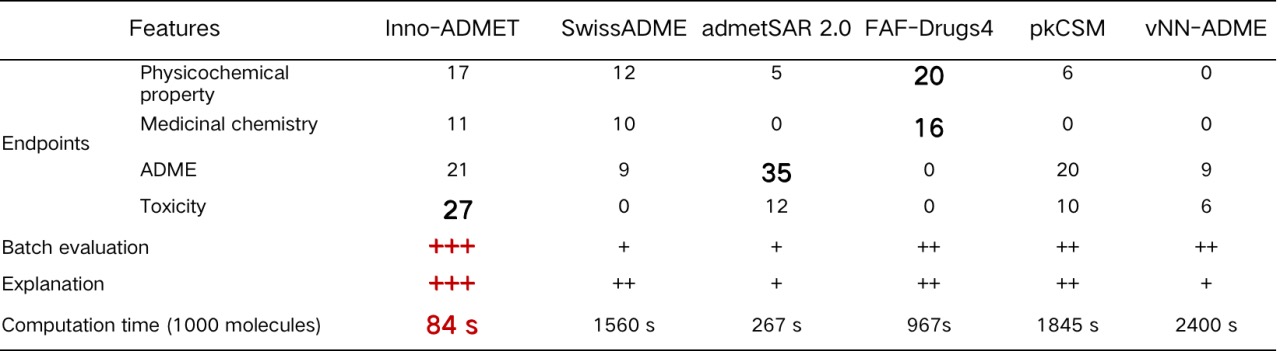
Table 2. Average evaluation results of different platforms.
5. Related Literature
[1] Chemistry-intuitive explanation of graph neural networks for molecular property prediction with substructure masking. Wu Z, Wang J, Du H, et al. Nat Commun. 2023;14(1):2585. doi:10.1038/s41467-023-38192-3
[2] ADMETlab 2.0: an integrated online platform for accurate and comprehensive predictions of ADMET properties. Xiong G, Wu Z, Yi J, et al. Nucleic Acids Res. 2021;49(W1):W5-W14. doi:10.1093/nar/gkab255
[3] ADMETlab: a platform for systematic ADMET evaluation based on a comprehensively collected ADMET database. Dong J, Wang NN, Yao ZJ, et al. J Cheminform. 2018;10(1):29. Published 2018 Jun 26. doi:10.1186/s13321-018-0283-x