Structure Extraction and Table Recognition
1. Overview of Structure Extraction and Table Recognition
Structure Extraction and Table Recognition is a tool that can quickly convert chemical structures and tables from patents, documents and various images into editable formats. As we all know, the mining and analysis of patent data are crucial for drug development. However, traditional methods rely on medicinal chemists to manually organize a large number of patents, using chemical structure drawing tools to manually draw a large number of chemical structures and mark active data. This process can take several days to several weeks. Faced with this challenge, CarbonSilicon AI has developed this structure extraction and table recognition module. Medicinal chemistry experts only need to upload the PDF file of the paper or patent to obtain the molecular structures and table data in the document. This function can help researchers solve the problems of "drawing structural formulae is time-consuming and prone to errors" and "batch collection of chemical structure information in patents or literature is time-consuming and prone to omission of analysis", saving the time and labor of drawing chemical structures, improving the efficiency of batch processing of chemical structure data, and quickly building their own database.
2. Instructions for use
Users only need three steps to complete the calculation: upload files (PDF or images) - select the extraction range - submit the task (mandatory).
The platform provides two ways to upload files: local files and data center.
- Local Files
The checkbox is set to "Local Files" by default. Click the button below to select the local file. After the file is selected, the file name will be displayed on the button, and the content of the file will be displayed on the right. The file formats currently supported for upload are .pdb, .jpg, .jpeg, .png, .bpm.
- Data Center
Check the checkbox "Data Center", click the button below, and a pop-up window will appear on the page. Click the file name to select the data from the data center, and after clicking, the pop-up window will disappear, and the content of the file will be displayed on the right.
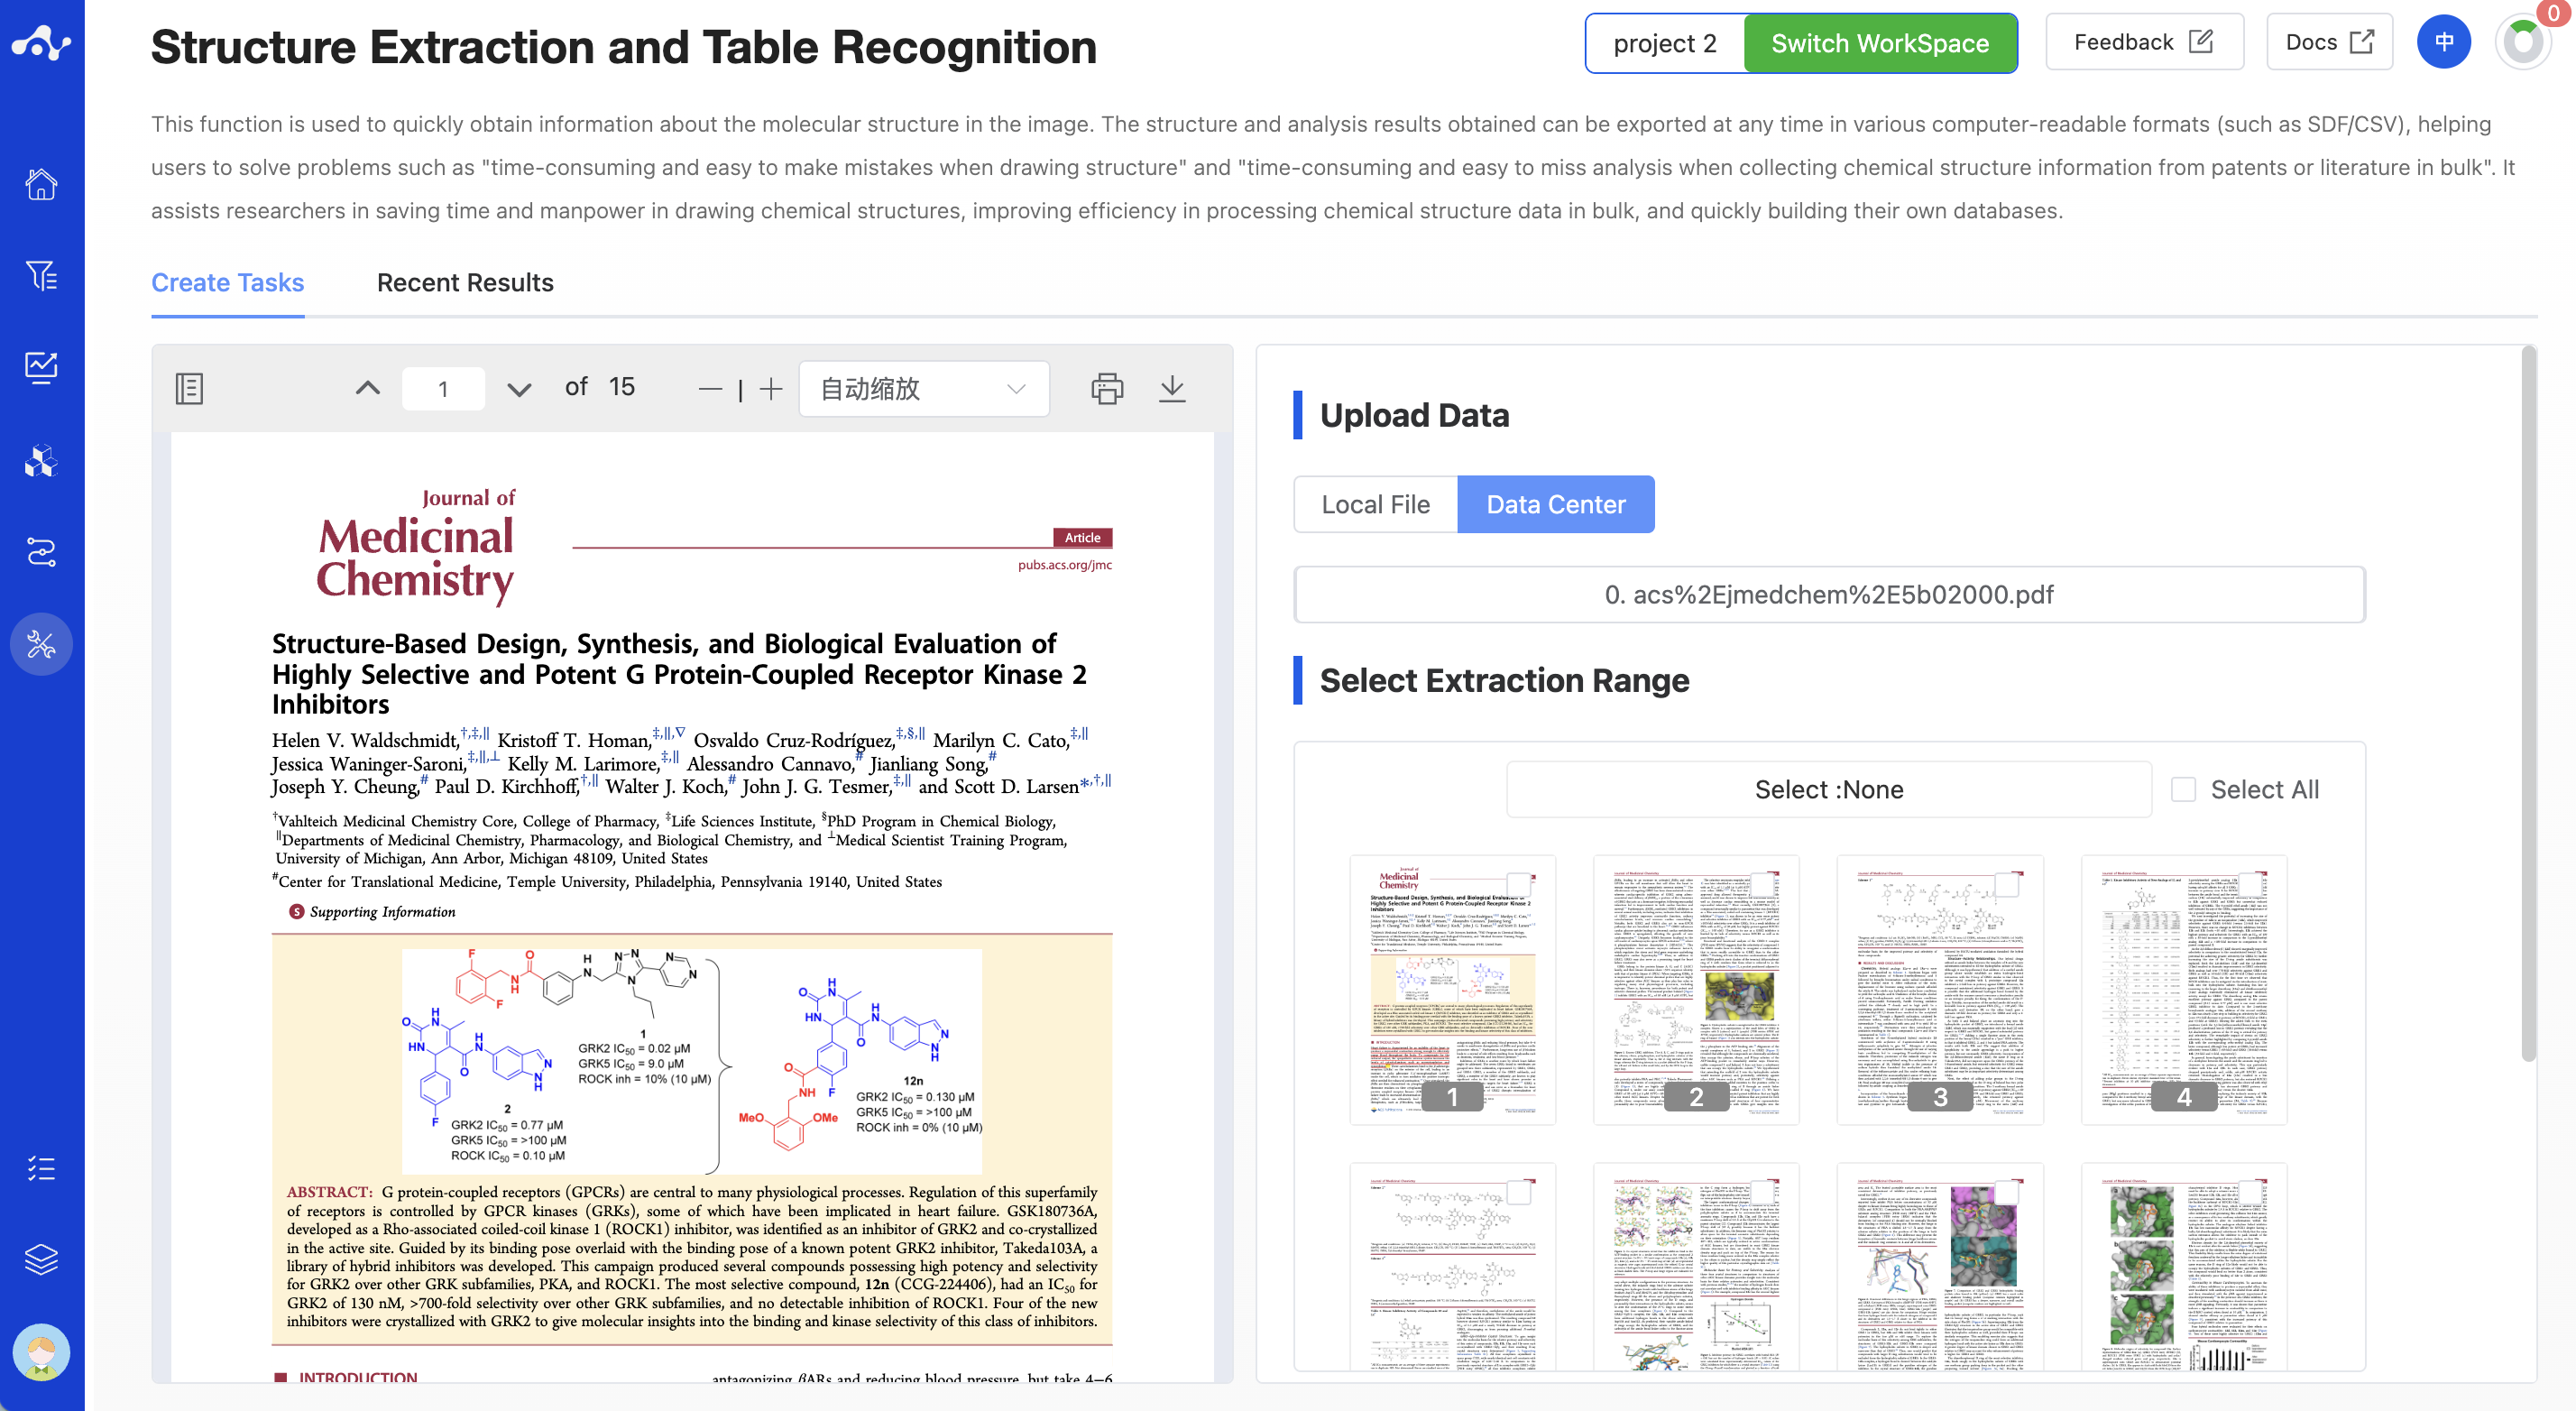
Figure 1. Upload Files - Local File/Data Center
(2) Select Extraction Range
Here you need to specify the range of document pages you want the system to extract. For the PDF file you uploaded, the system will parse the number of pages in the file and display the page content screenshots below. You can manually check the page screenshots to select the extraction range, or you can check the [Select All] button in the upper right corner to select all pages in the file at one click.
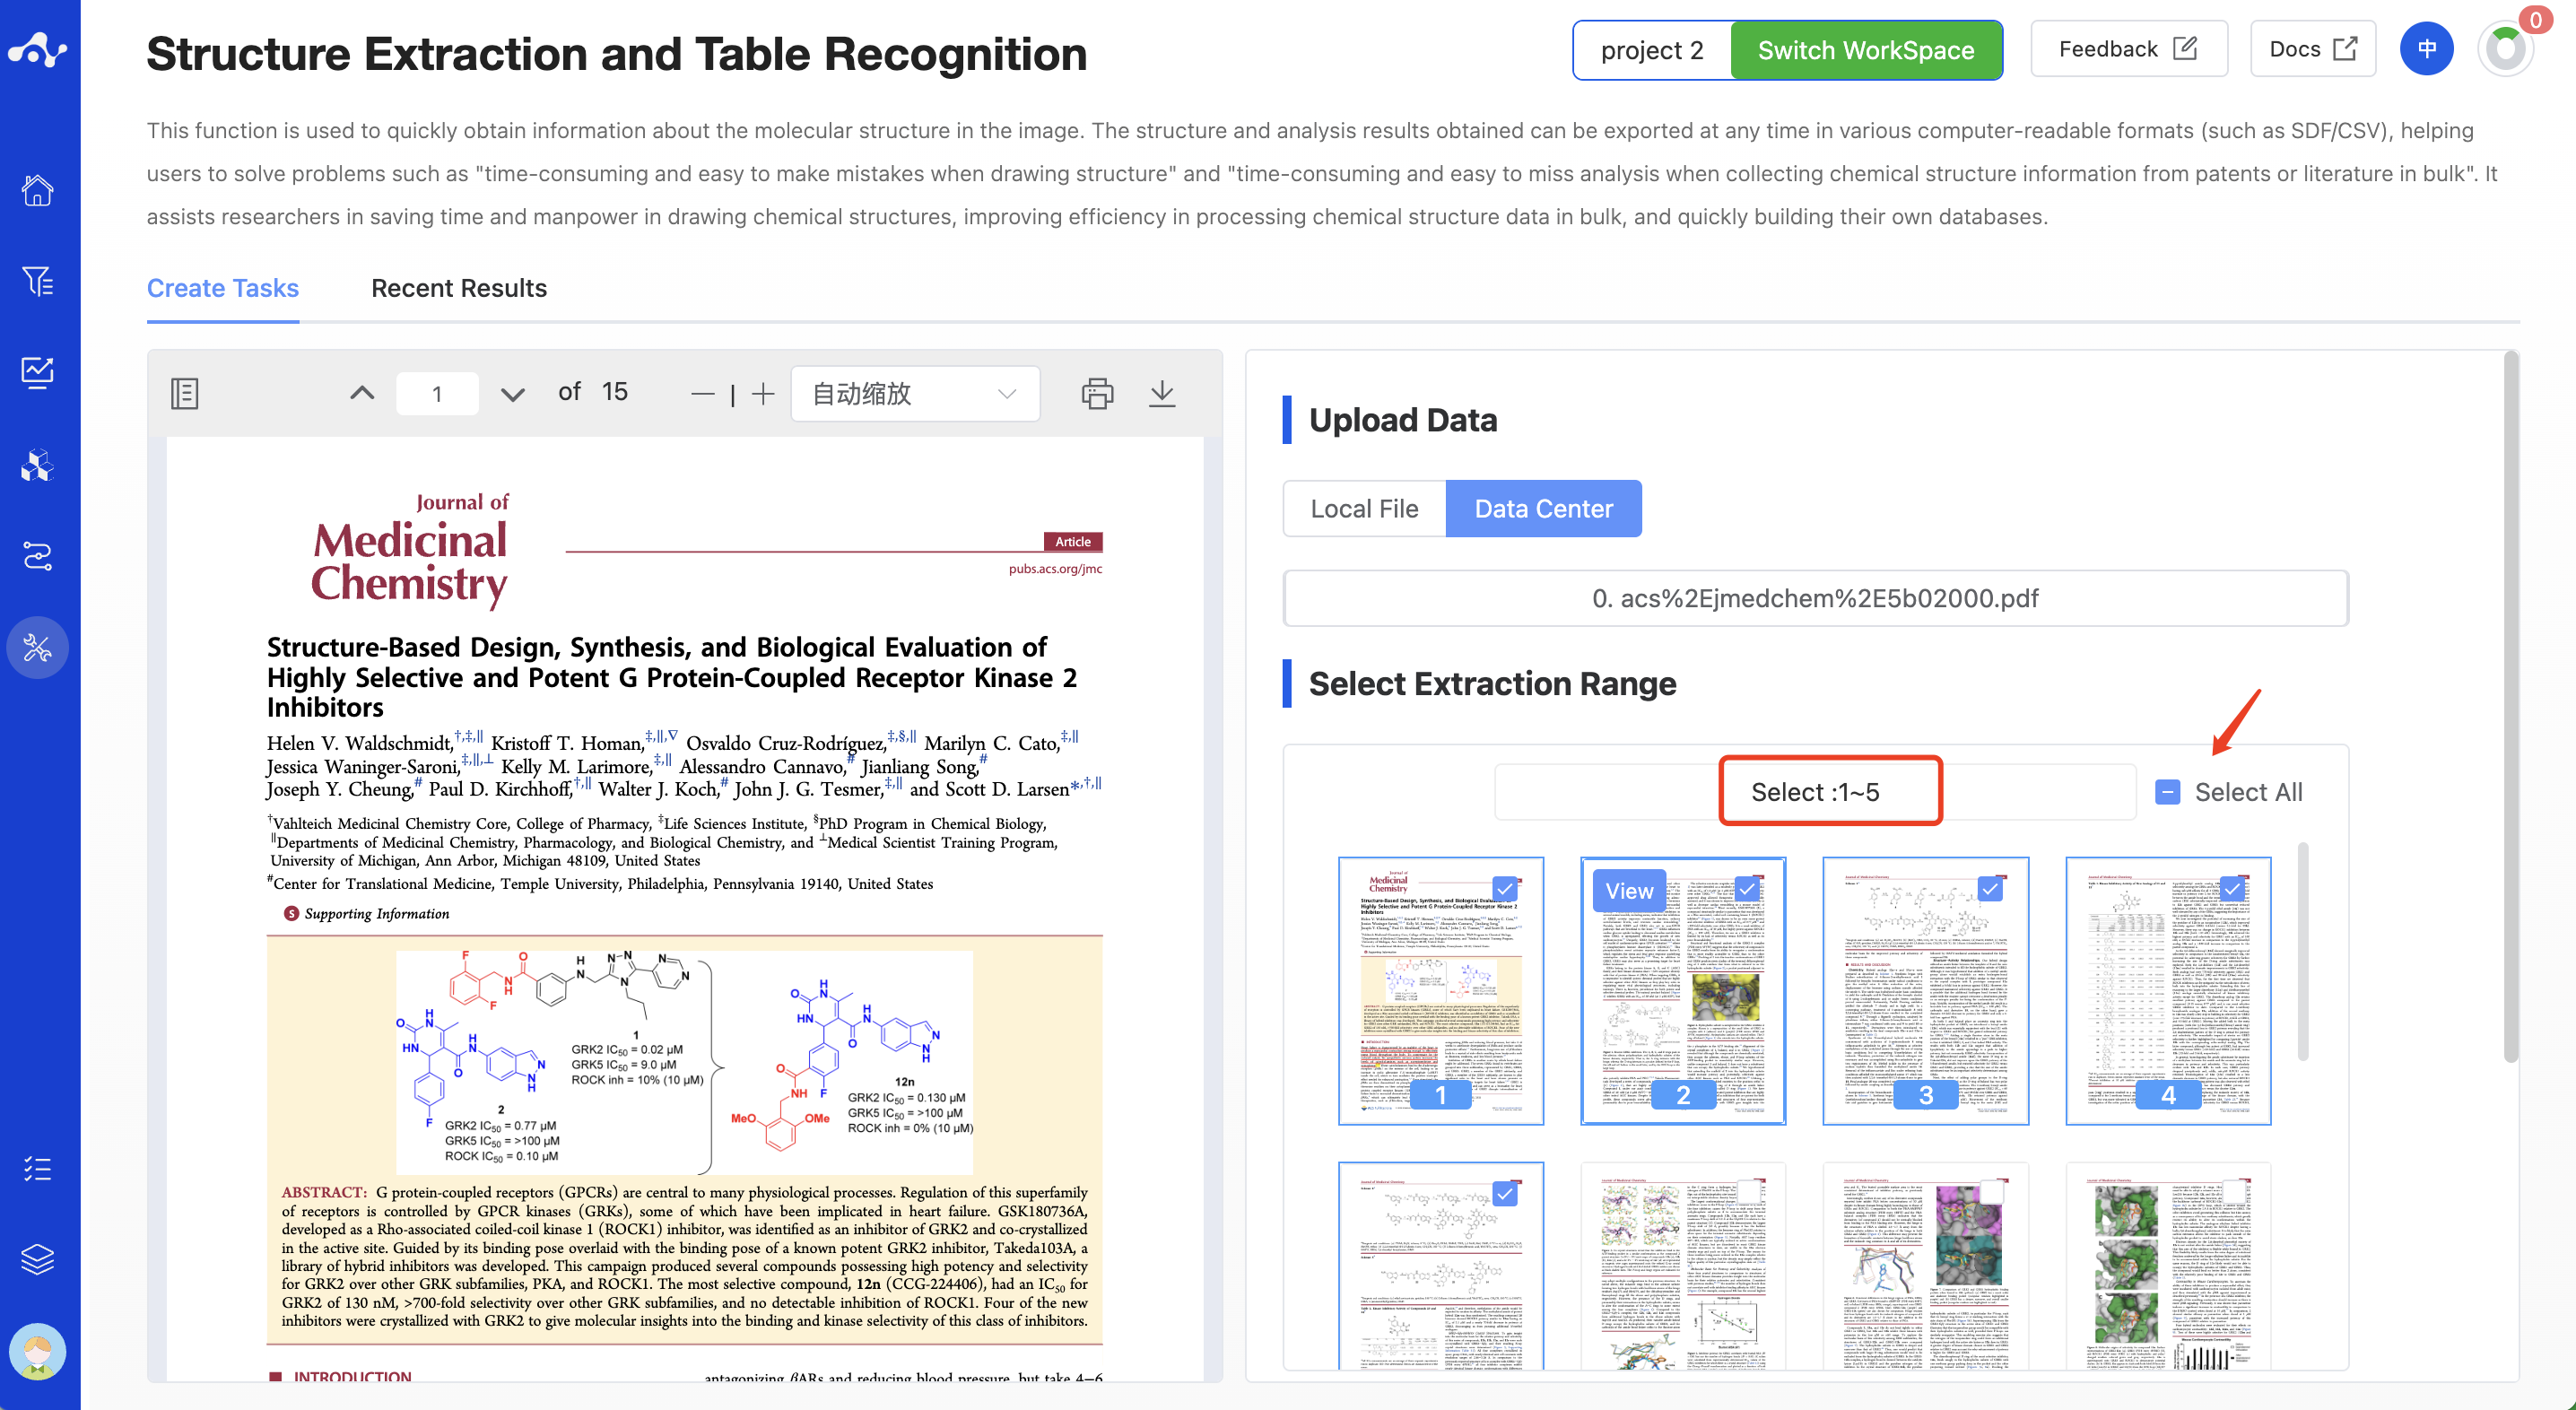
Figure 2. Select the Extraction Range - Manually Check Pages
(3) Running Progress and Result Viewing
After submitting the task, the system will immediately enter the result page and return the parsed molecules and tables page by page. For the parsed molecules, you can first proofread the accuracy of the structure and content. Or if you want to wait for all pages to be parsed before analyzing, you can also jump to other pages, such as jumping to other modules or the calculation page of the current module to initiate a new task. This operation will not affect the normal progress of the submitted task. You can always enter the running task to view the parsed molecules.
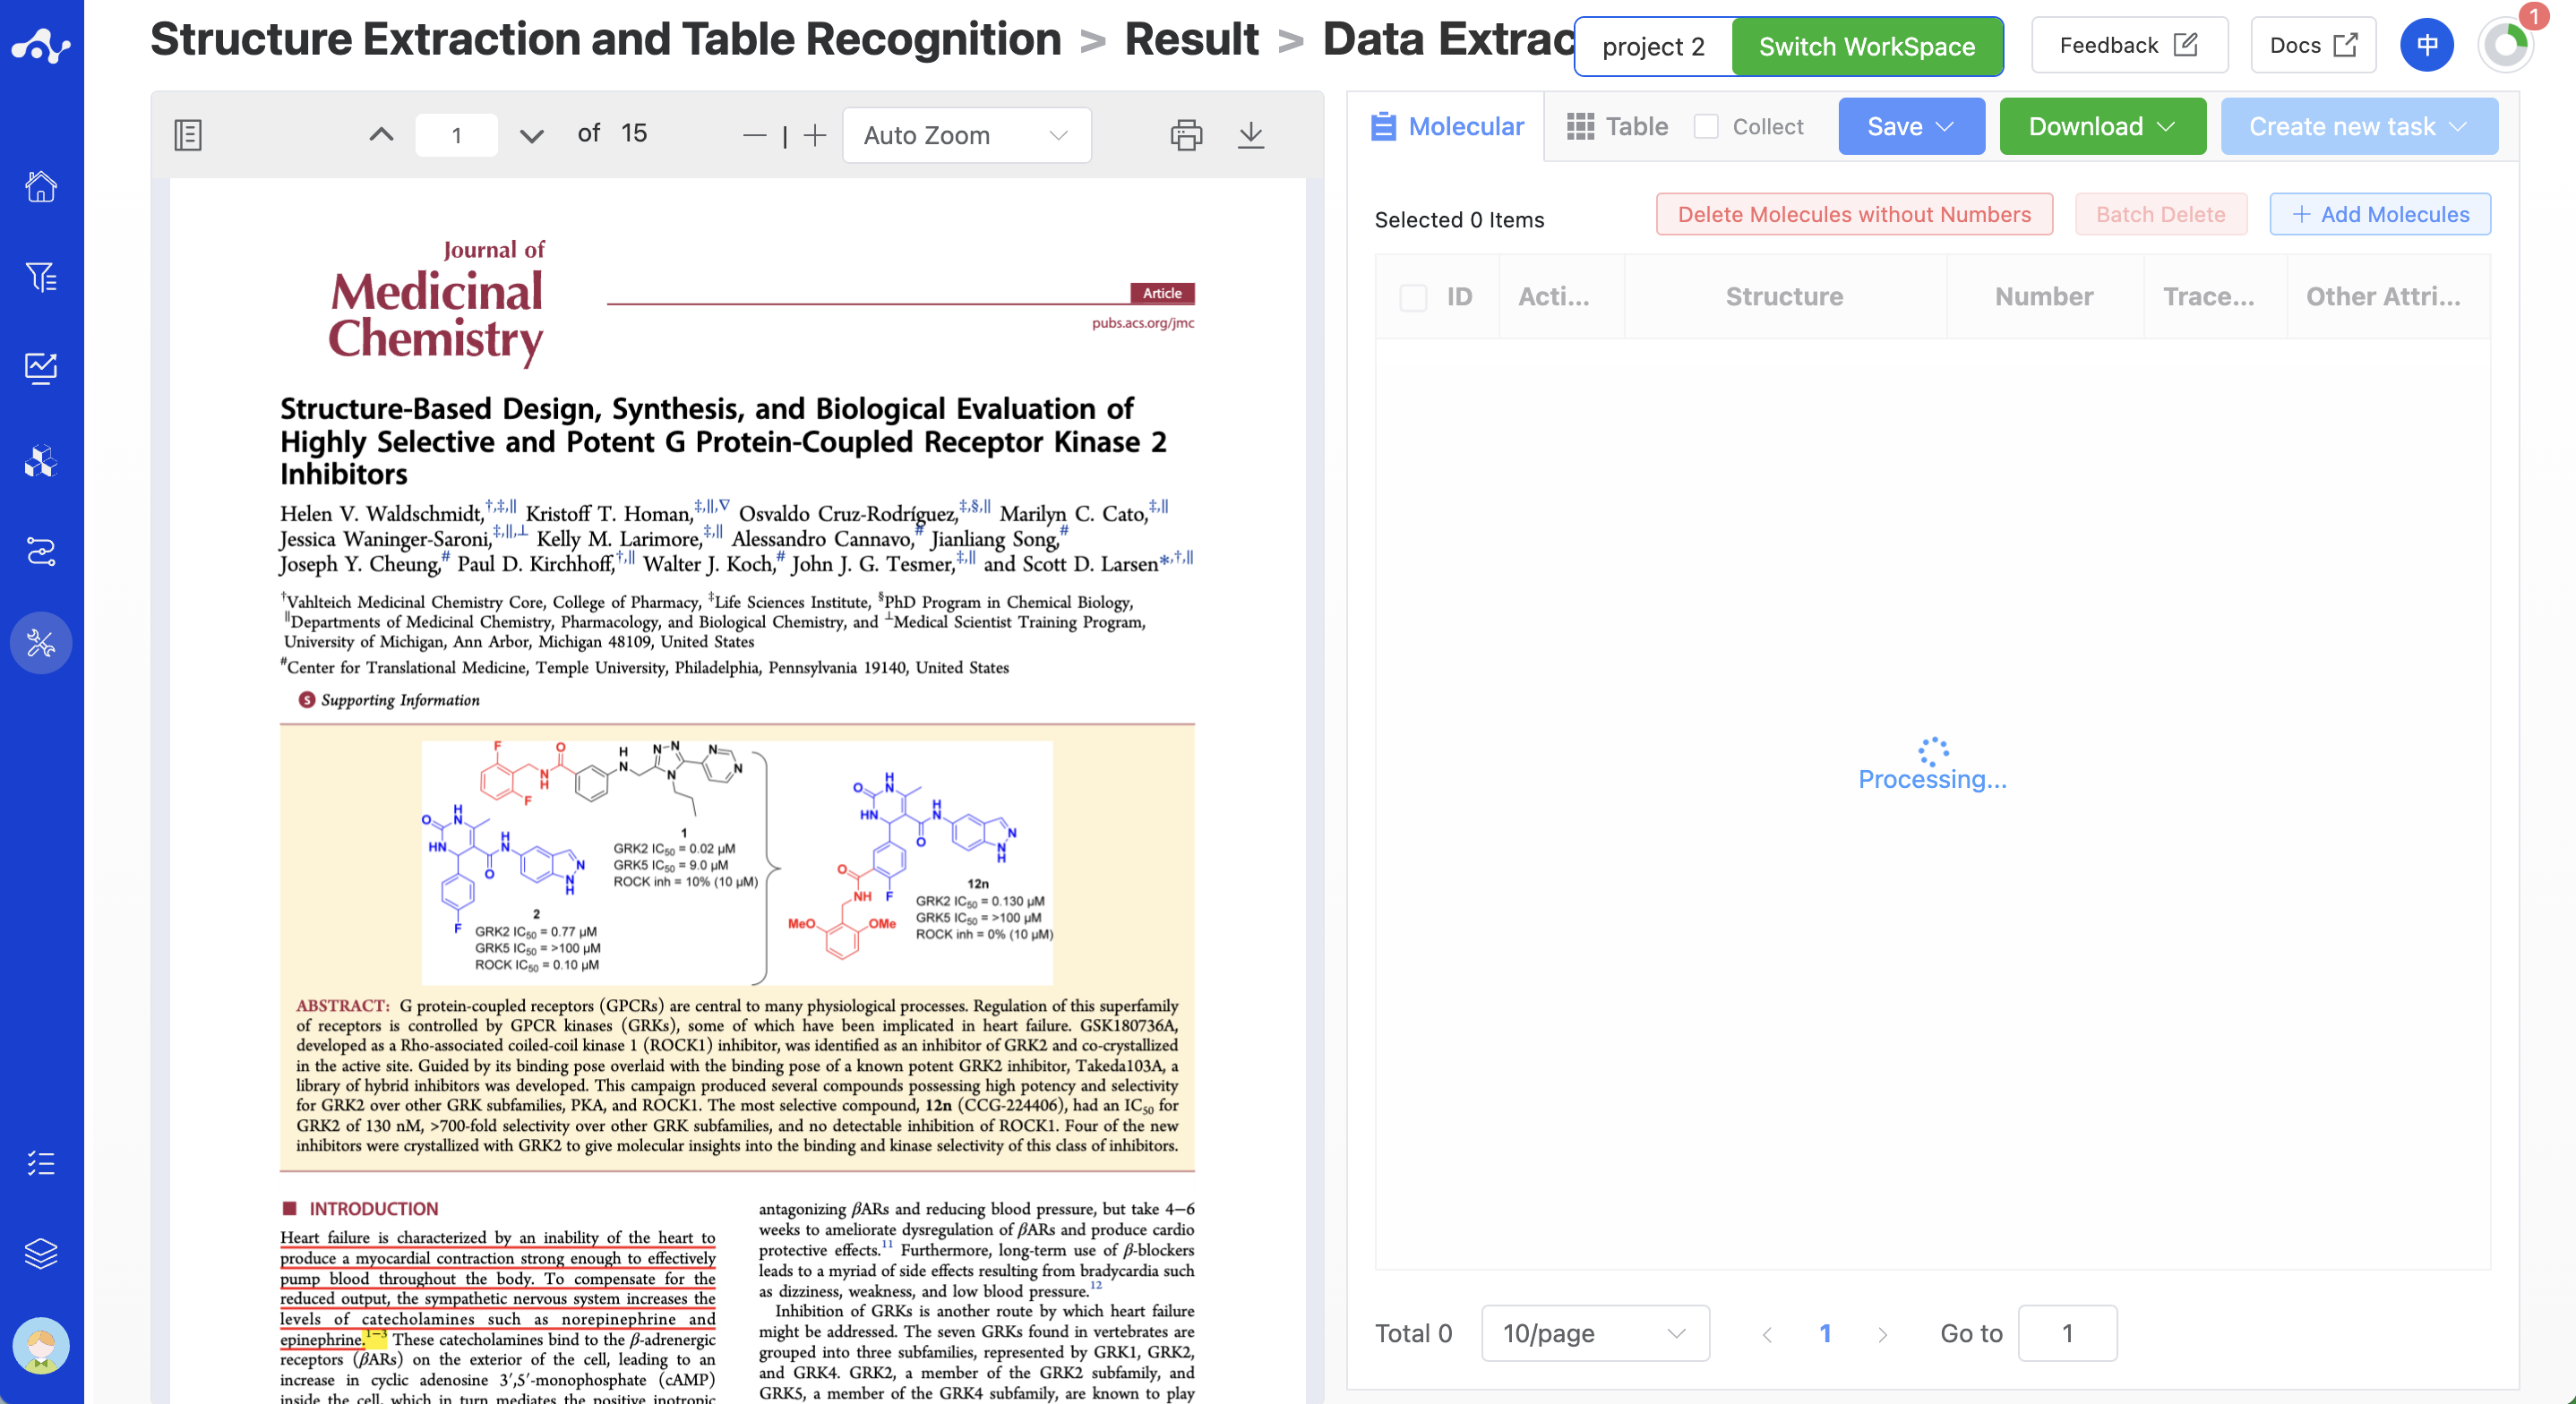
Figure 3. View Results - The status of jumping to the results page after submitting a task
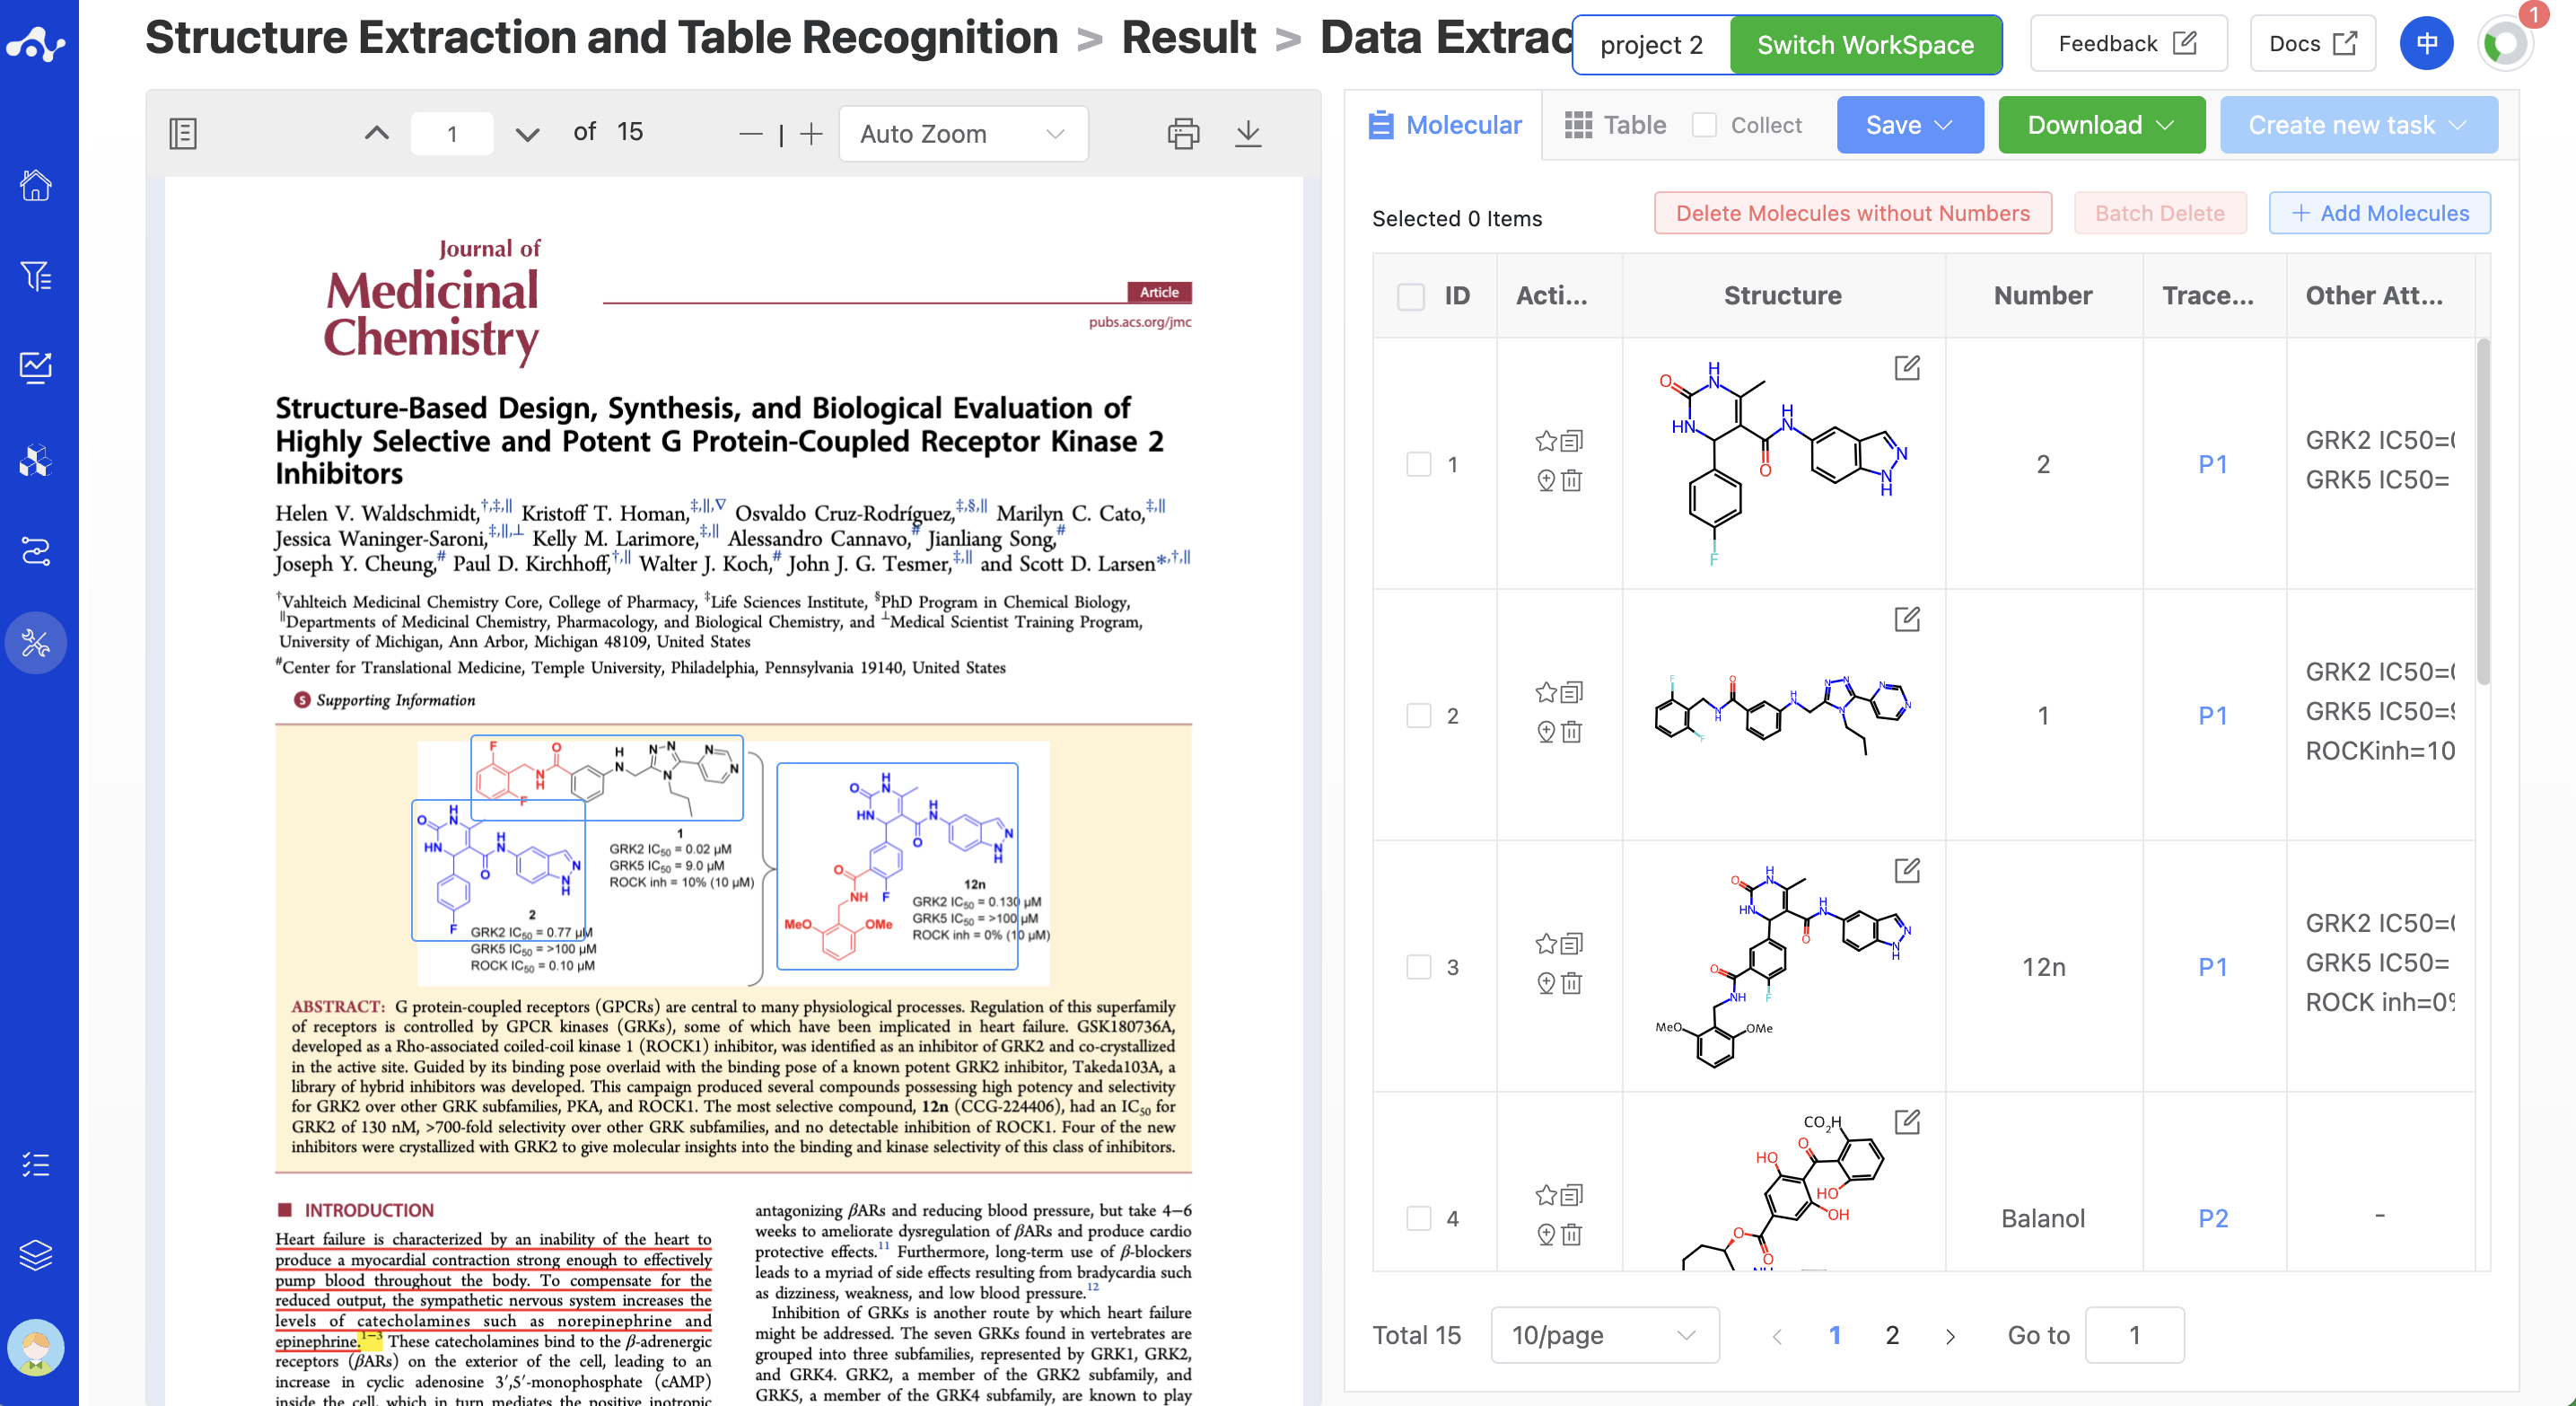
Figure 4. View Results - The result page that returned 2 pages of molecules, and the task is still running
3. Result Analysis
The display of the result page is mainly used for quickly checking the accuracy of the structure and content. We provide a series of functions to help you check and modify. The content of the PDF file is displayed on the left by default. In the PDF viewer, there will be a light blue positioning box around the structure. Click the positioning box, the color changes from light blue to dark blue, the border thickens, and the positioning box below will provide related buttons (delete, edit positioning box, and traceability function). The content on the right, the system defaults to display the molecular list, this page displays the molecular structure information and some auxiliary information. You can also switch to the chart page, which mainly displays the content of the chart. You can switch according to your needs, usually, these two pages complement each other and are better used in combination for a better experience.
3.1 Molecule list page
The molecular list page displays all the molecules identified by the system, including information around the molecular structure and positioning information.
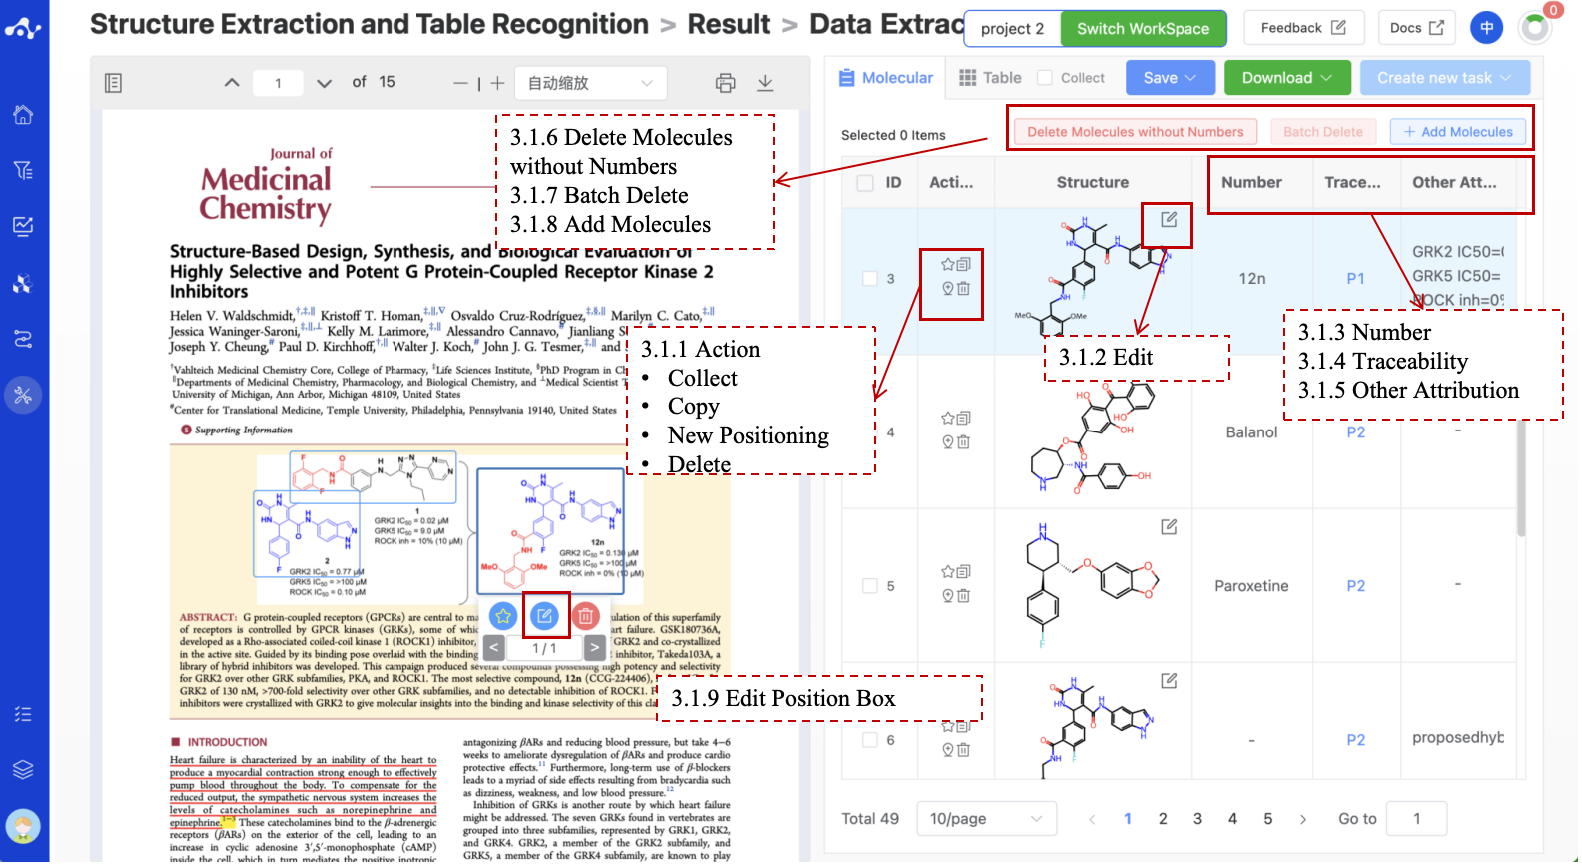
Figure 5. Result Page- Molecular list
3.1.1 Actions
The operation column provides some shortcut icons, including Collect, Copy, Delete, and New Positioning, which can help you to better mark molecules.
Collect. Tag the molecule, which can be combined with the [Collect] function to quickly filter out the favorite molecules.
Copy. After clicking the copy icon, the page will be in the form of a lower bubble for secondary confirmation, to confirm whether to copy Smiles or copy entries , after clicking the corresponding text, the system will give a corresponding prompt. If you click [Copy Smiles], if the copy is successful, the page will prompt the user to copy successfully, and if the user clicks [Copy entry], the system will copy the same line at the end of the list and immediately jump to the copied line, and you can modify and adjust the information of this entry.
Delete. After clicking the Delete button, a second confirmation in the form of a lower bubble will be displayed on the page. You will be prompted "This operation cannot be restored. Are you sure to delete the selected molecule? ".
Add Positioning. If the molecule appears several times in the article, but the system only recognizes it once, you can use this function to categorize the same molecule.
3.1.2 Molecular Structure Editor
The chemical structure column mainly shows the recognized molecular structures. For recognized wrong structures, you can click the Edit button in the upper right corner of the molecular structure to enter the molecular editing page.
When the system incorrectly recognizes a fragment structure as a complete structure, you can use the editor to hover the mouse over the atom that should be the break point, right-click and select 'Edit' to enter the editing state, and then enter an "*" in the Alias field to correct the structural information. Sometimes, for Markush structures, the system may misidentify structures like R1, R2 as something else. When such errors occur, you can also modify them in a similar manner by entering R1, R2 in the Alias field.
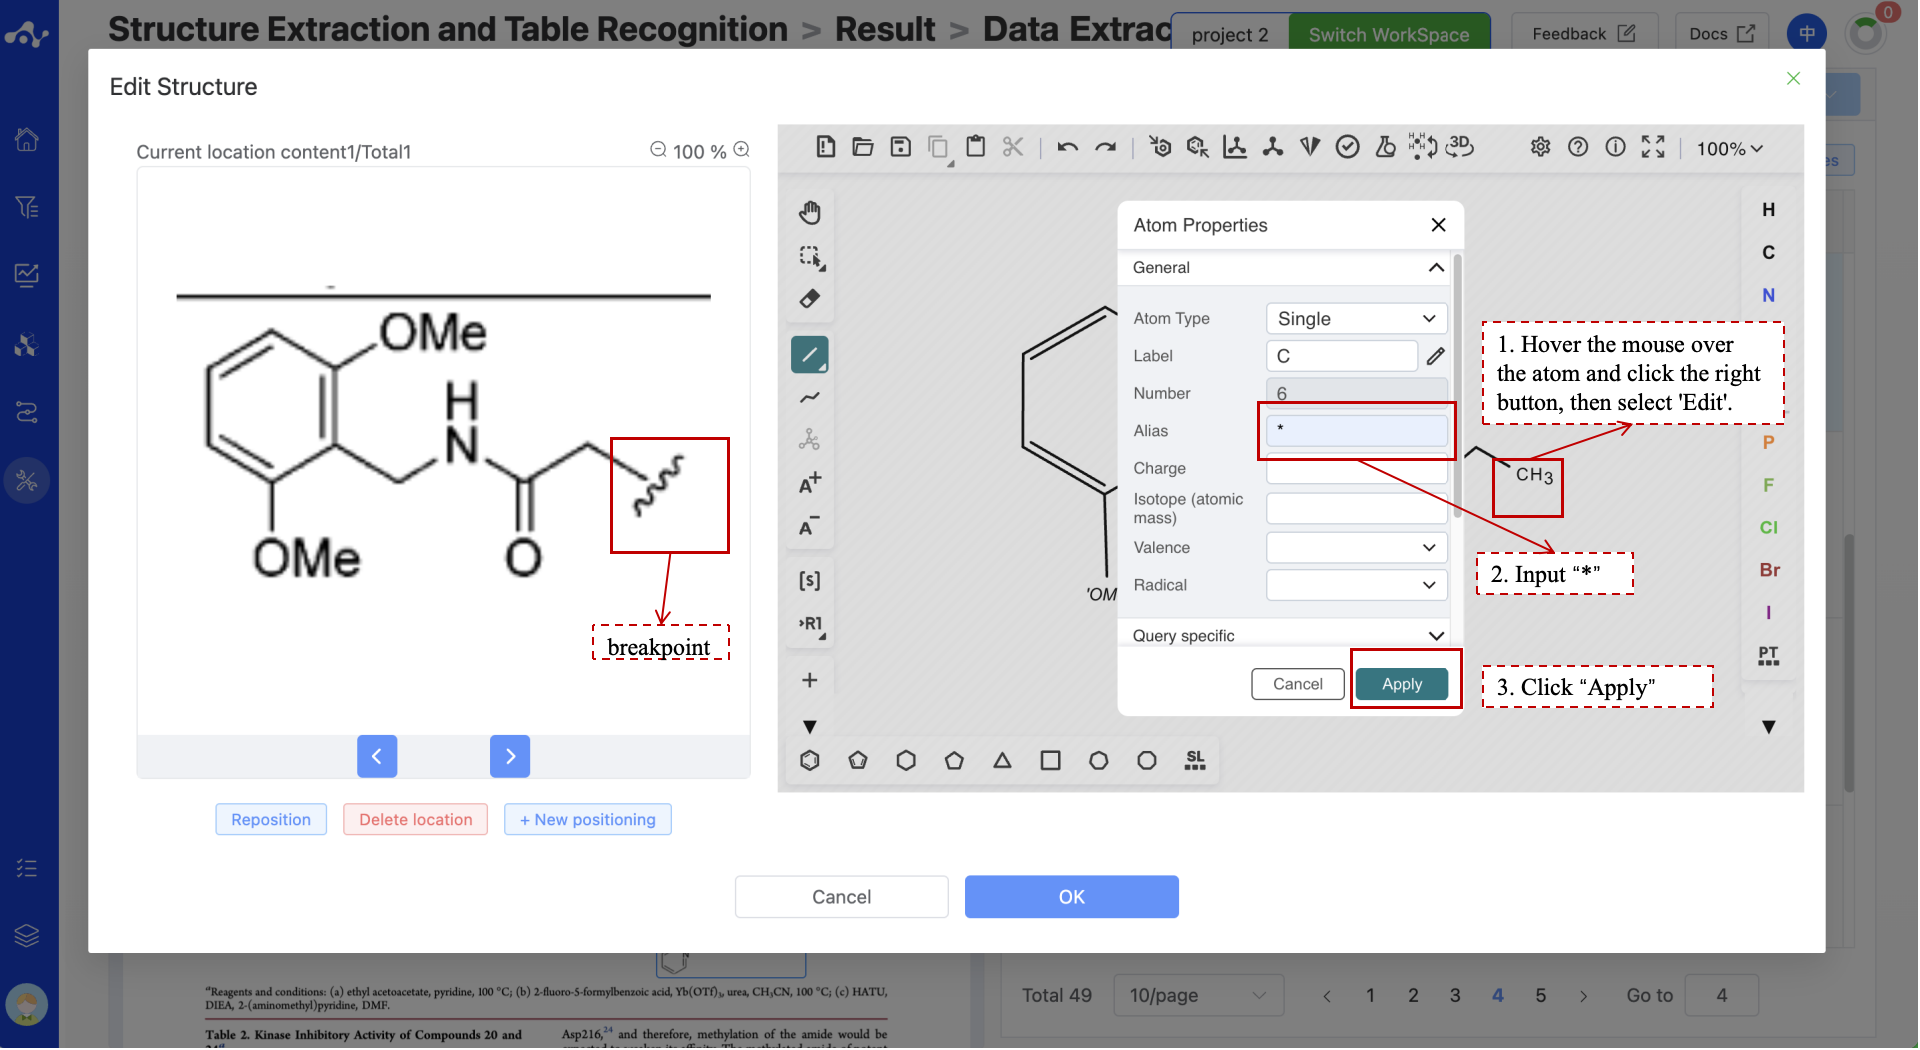
Figure 6. The molecular editor
3.1.3 Numbering
The number column is automatically recognized according to the information near the structure. When the recognized number information is incorrect, you can double-click the cell to enter the editing state, click elsewhere to exit the editing state and the system will prompt the modification is successed. As number in the system is unique, when you modify the number that conflicts with the existing number, the system will prompt and refuse to modify.
3.1.4 Traceability
The traceability column is to help you better categorize molecules. When the same molecule may appear several times in the document, we can use the information in this column to know how many times the molecule has appeared in the text, and click page number to quickly locate the page where the molecule is located.
3.1.5 Other Attributes
The other attributes column is also the information automatically recognized based on the information near the structure, this will not be automatically associated with the information in the table. if you want to view the information in the table, you can go to the Table page to view. When the recognized information is incorrect, you can double-click the cell to enter the editing state, click elsewhere to exit the editing state, and the system will prompt the modification is successful.
3.1.6 Delete Molecules without Numbers
When you click this button, all unnumbered molecules in the list will be deleted. After clicking this button, a second confirmation will be made in the form of a bubble box, prompting: This operation cannot be restored. Are you sure to delete the molecule?
3.1.7 Batch Delete
There is a checkbox in front of each molecule, when you check more than 2 molecules at the same time, the button Batch Delete is available. After clicking this button, a second confirmation will be made in the form of a bubble box, prompting: This operation cannot be restored. Are you sure to delete the selected molecule?
3.1.8 Adding Molecules
When you find that the system has missed molecules, you can click the “Add Molecule” button to parse the molecule. After clicking this button, there will be prompts on the page “Please select the molecular structure or name in the original text” or “Exit”. At this time, you can slide the PDF file and draw a properly sized positioning box on the missed molecule, and then click confirm. At this time, the system will enter the transition state of analysis and parsing. When the molecule is parsed, the page will pop up the molecular editor, and you can proofread the accuracy of the analyzed structure. If there is any error, you can modify it in the editor. After the modification is correct, click confirm, and the newly added molecule will appear in the last line of the table.
3.1.9 Edit Position Box
When you find that the detected molecular structure positioning box is shifted, resulting in inaccurate structure recognition, you can click the positioning box of the molecular structure, and then click the edit icon below to enter the positioning box size editing page. After you adjust the positioning box to the right size, you can click confirm. At this time, the system will enter the transition state of analysis and parsing. When the molecule is parsed, the page will pop up the molecular editor, and you can check the accuracy of the parsed structure. If there is an error, you can modify it in the editor. After the modification is correct, click confirm, and the newly added molecule will appear in the last line of the table.
3.2 Chart Page
The chart page lists all recognized tables and converts the parsed content into an editable format for your review and modification. In addition, the system also provides some advanced features to enhance your efficiency. Such as the associated numbers , and the splicing of parent nucleus molecular structures with R groups.
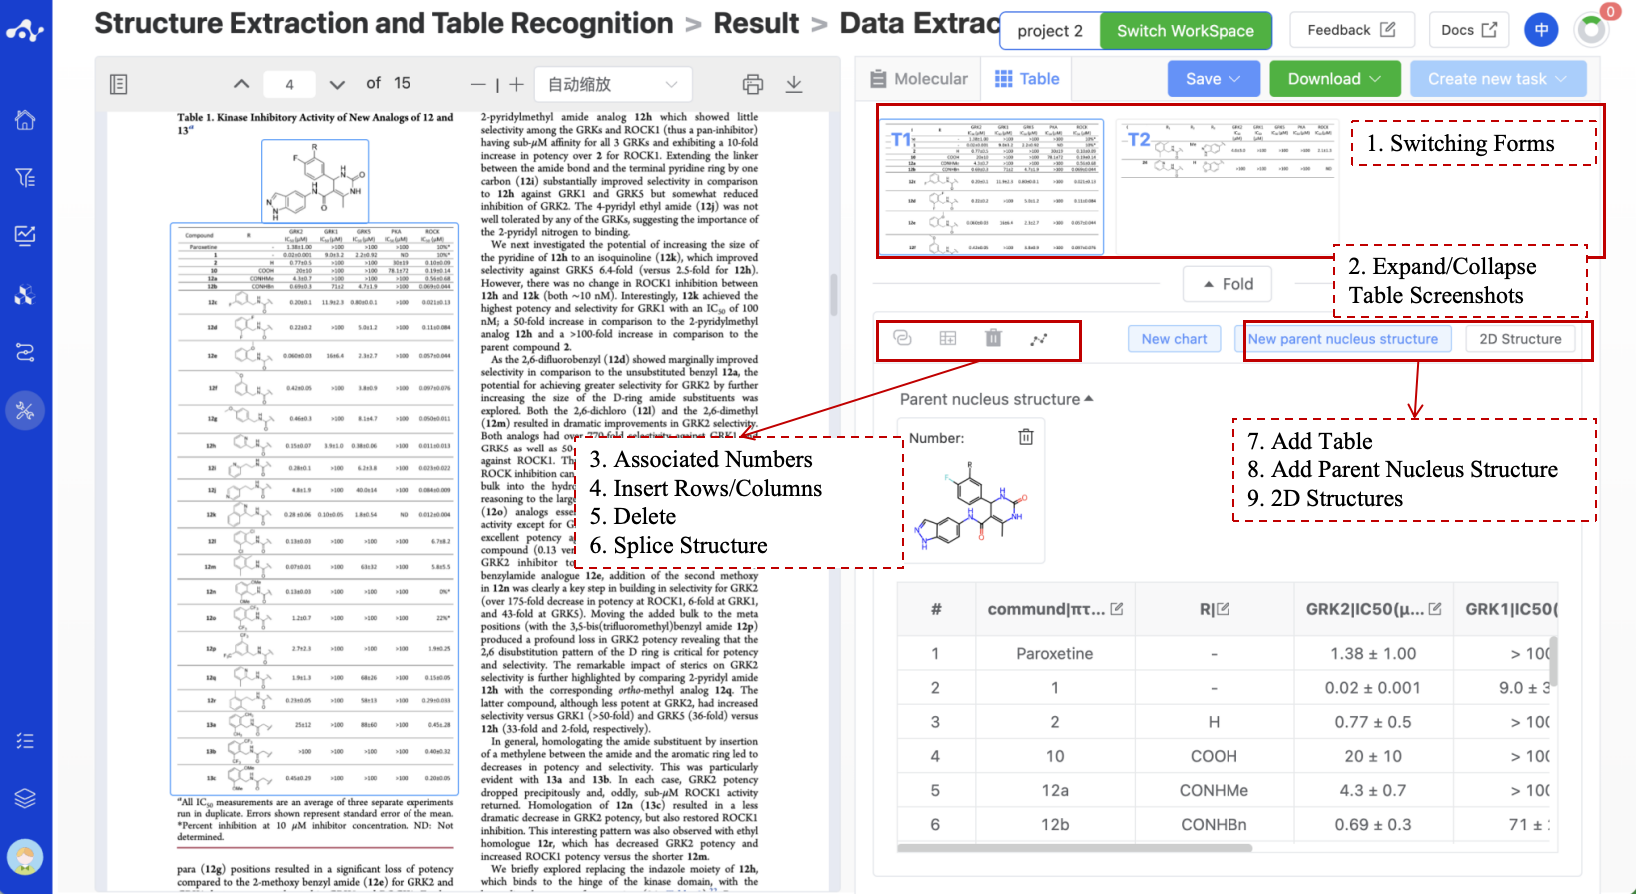
Figure 7. Result Page- Table
3.2.1 Switching Forms
This area displays all the table screenshots parsed by the system. The system defaults to select and display the first recognized table. When you want to see the content of other tables, click the table screenshot, the system will quickly locate the position of the table in the PDF, and display the parsed table content on the right. When you find that there is a misdetection, put the mouse on the screenshot, and the delete icon will appear below the picture, click to delete to delete the incorrect information.
3.2.2 Expand/Collapse Table Screenshots
This function is mainly for you to focus on the content of the table and provide more space to show the content of the table.
3.2.3 Associated Numbers
The number in the system is unique. When there are only numbers and no structures in the table, and the structure is displayed elsewhere, you can select the column representing the number in the table, and then click the associate number button. The system will search for the same number in the molecular list. If the same number is found, it means it is the same molecule, so the structure information of this molecule will also be displayed on the table page. After the structure information is associated, the system defaults to display the Smiles of the molecule structure. Users can use the “2D Structure” button to display/hide the 2D structure. When you find that the association fails, it is likely that the numbering in the table is inconsistent with the number in the molecular list. At this time, you can modify any number to make it exactly the same as each other, and use the associated function again to successfully associate it.
3.2.4 Insert Rows / Insert Columns
When you select a cell, the Insert Row/Insert Column is available. The system will insert an empty row and column according to your selection for you to manually fill in the information in the table.
3.2.5 Delete
When you select a cell, the Delete button is available. The system will delete a row or a column according to your operation. This operation is not recoverable and should be used with caution.
3.2.6 Splice
This feature supports the splicing of parent nucleus structure and R groups. After you clicks the splice button, the system will prompt you to select the parent nucleus structure information and R group columns to be spliced through a pop-up window. The system will then splice the structures based on the input and add a new 'structure' column behind the R group column to display the complete molecular structure. It should be noted that the splicing criteria of the system vary depending on the core structure.
When there is only one R group on the parent nucleus structure, that is, one break point, the system will splice based on the information of the specified R group column regardless of its name, and the requirements are relatively relaxed at this time;
When there are multiple R groups on the parent nucleus structure, that is, multiple break points, the names of the R groups on the parsed core structure must correspond one-to-one with the names of the splicing columns (without case sensitivity, core R1 corresponds to the column name R1, core R2 corresponds to the column name R2), otherwise, the splicing will fail.
3.2.7 Add Table
When the system has missed the table, you can use this function to add a new table. When you find that the system has missed the table, you can click the “Add New Table” button to parse the table. After clicking this button, there will be prompts on the page “Please select the table in the original text” or “Exit”. At this time, you can slide the PDF file and draw a properly sized positioning frame on the missed table, and then click confirm. At this time, the system will enter the transition state of analysis and parsing. When the table is parsed, the page will prompt whether the parsing is successful or failed.
3.2.8 Add Parent Nucleus Structure
When the molecule in the table is a fragment structure, there should be a parent molecule corresponding to it. If the system does not recognize a parent structure, you can add a new one using this button and then use the splice function.
3.2.9 2D Structures
The full name is Show/Hide 2D Structures. This button is not available when there is no 2D structure to show in the form. When there is a displayable 2D structure in the form, the system defaults to show the information of smiles, and when the 2D structure is selected, the system converts smiles to 2D structure.
3.2.10 Table Editing
You can double-click the cell to enter the editing state, and click elsewhere to exit the editing state, and the system will prompt the modification is successful.
3.3 Save
Click "Save", the system will pop up a drop-down box for you to choose the file format (currently only supports .csv). In the molecule list page, the system saves the molecules under the current conditions. If you do not check “Collects“, it will save all the molecules in the molecule list, if you check “Collects“, the system will only save the collect molecules. On the Chart page, clicking Save will save the contents of the current table to the data center.
3.4 Download
Click "Download", the system will pop up a drop-down box for you to choose the file format (currently only supports .csv). In the molecule list page, the system downloads the molecules under the current conditions. If you do not check “Collects“, it will download all the molecules in the molecule list, if you check “Collects“, the system will only save the collects molecules. On the Chart page, clicking "Download" will download the contents of the current table to the data center.
3.5 Creating New Tasks
The prerequisite for creating a new task is to save the data as a file first. Before executing the save operation, the button is disabled. When the results are saved as a new file, the button is available. At this time, click the button, and the system will pop up a drop-down box to let you choose the module to calculate. Click it, and the system will immediately open a new tab and bring the data set you saved, and you can submit a new task after adjusting the parameters.
4. Related Literature
Not available
