Inno-Rescoring
1. Overview of Inno-Rescoring
The Inno-Rescoring module provides outstanding scoring functions powered by machine learning algorithms. To make it easier for users to utilize these rescoring functions directly, the Rescoring module supports uploading relevant files of locally docked complexes for rescoring. Users can select a rescoring function to re-evaluate the binding affinity of protein-ligand binding poses.
2. Instructions for Use
Only four steps are needed to complete the calculation: upload the post-docking protein file – upload the post-docking ligand file – provide a task name (optional) – submit the task (required).
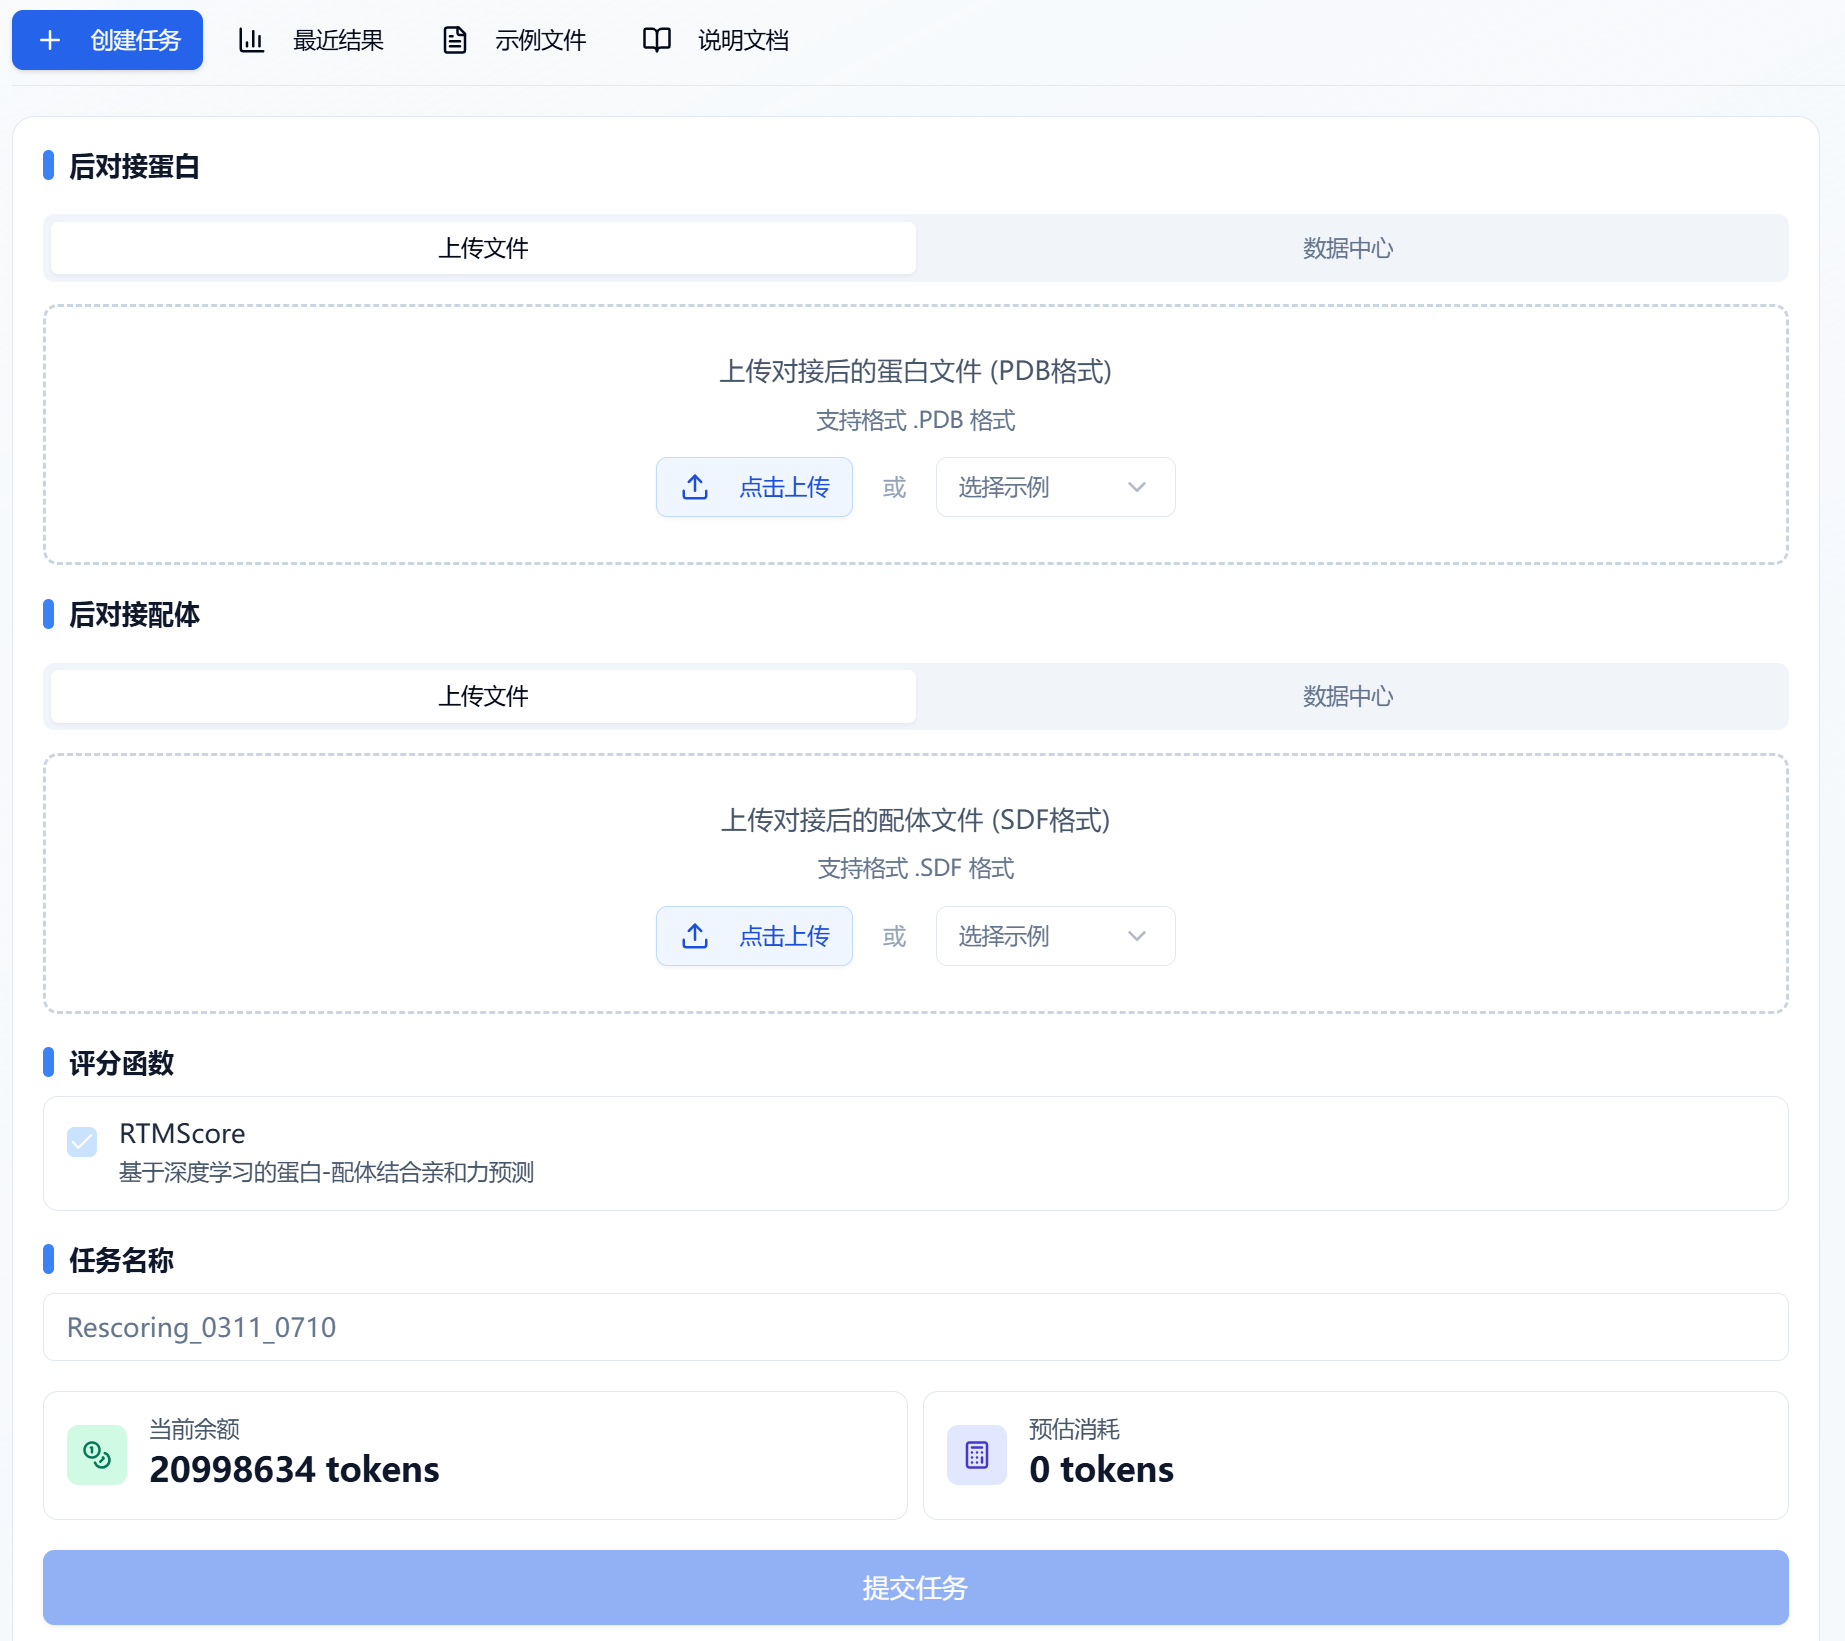
Figure 1. Uploading post-docking protein and ligand — file upload/data center
(1) Uploading the post-docking protein
The platform provides two ways to upload proteins: file upload or data center.
- File Upload
Select the "File Upload" checkbox and then click the button below to choose a file from your local device.
- Supported file format: .pdb
- Data Center
Select the "Data Center" checkbox and click the button below. A popup window will appear; click the desired file name to select data from the data center. The popup closes after selection.
(2) Uploading the post-docking ligand
The platform also provides two ways to upload post-docking ligands: file upload or data center.
- File Upload
Select the "File Upload" checkbox and then click the button below to choose a file from your local device.
- Supported file format: .sdf
- Data Center
Select the "Data Center" checkbox and click the button below. A popup window will appear; click the desired file name to select data from the data center. The popup closes after selection.
After confirming all parameters, you may name the task and click Submit to complete the task submission.
(3) Monitoring Progress and Viewing Results
After submitting the task, the page will automatically redirect to the "Recent Results" subpage, where you can check the current status of all tasks (progress bar). You can also view all running module tasks in the "Notification" dropdown on the top right. When working with large amounts of data, the system processes data in batches. As long as one batch is completed (even if the entire task is still running), you can click the "View Results" button to access the results page and see the list of completed prediction results (pending molecules will not be displayed). Refresh the page to check for the latest computed data.
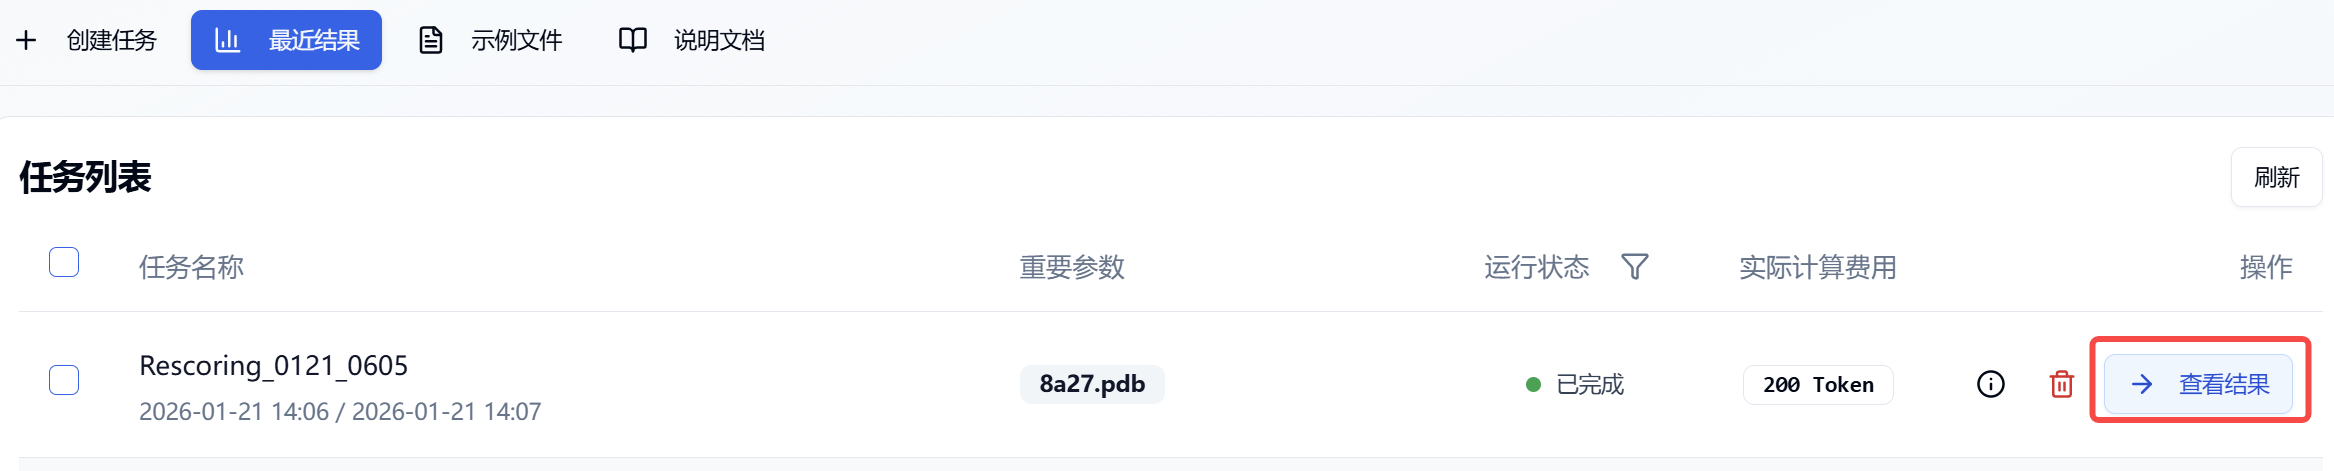
Figure 2. Viewing Results
3. Result Analysis
By default, the results page displays a table view. You can switch to grid view as desired. All scores are visible and can be sorted.
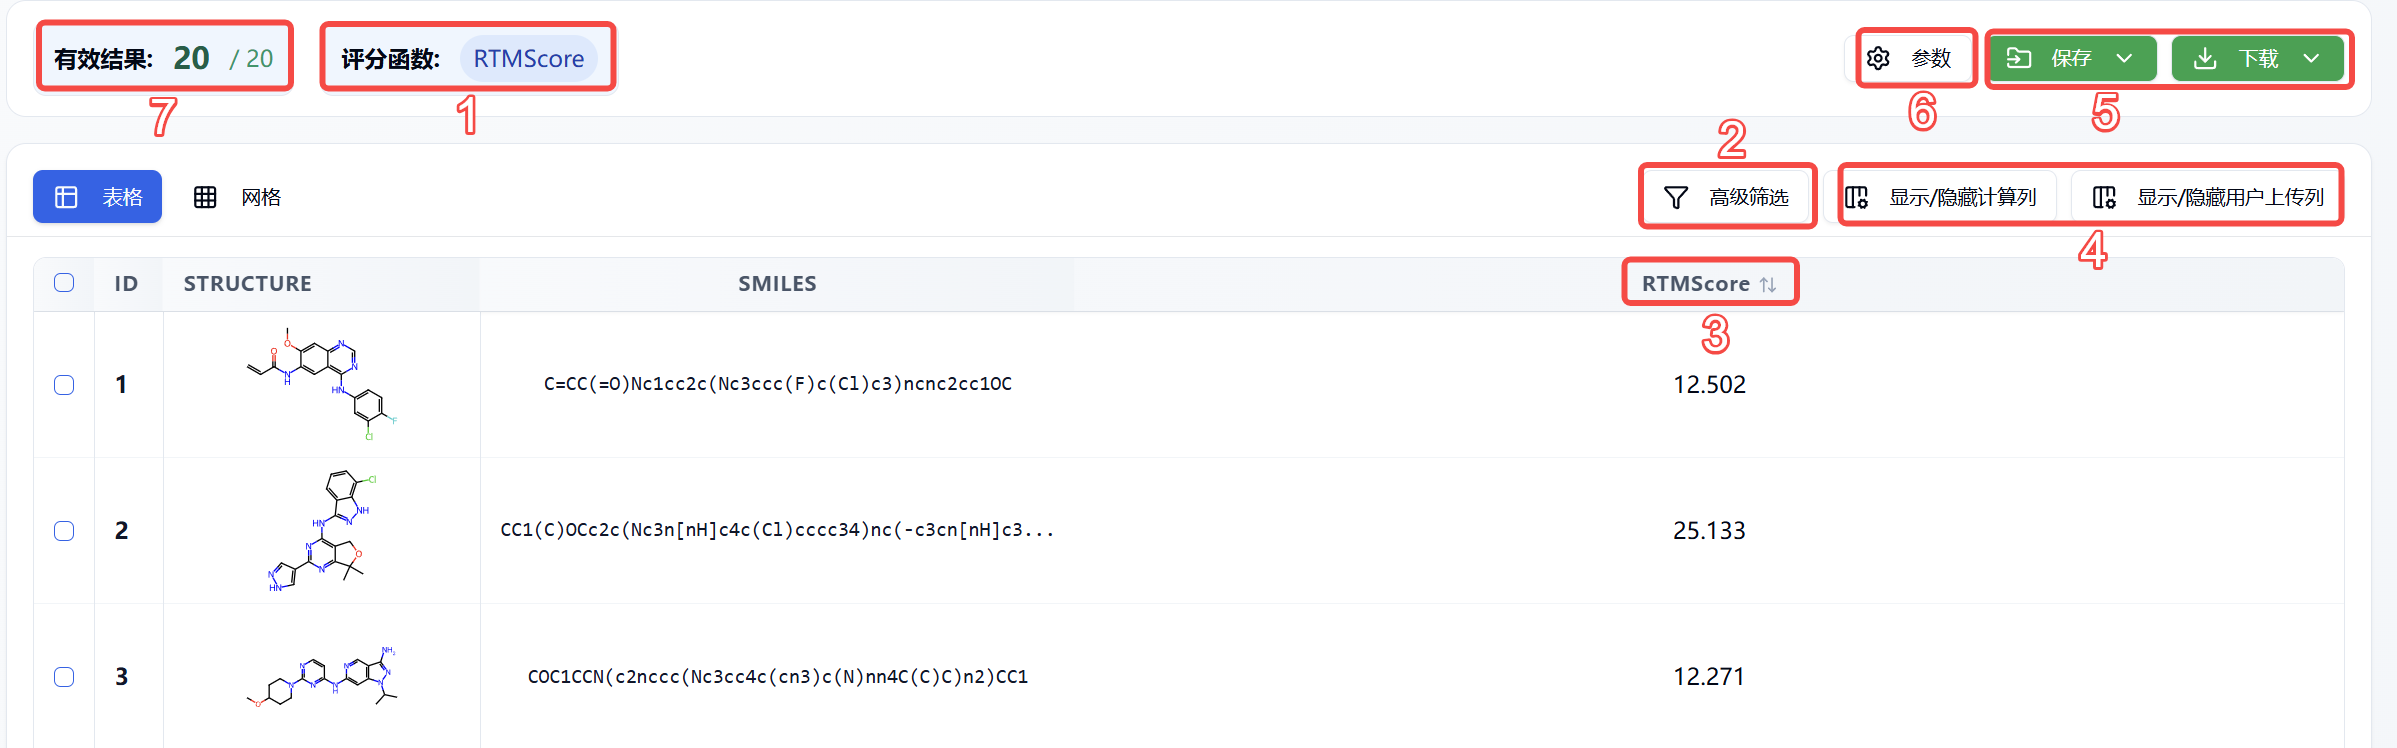
Figure 3. Features Distribution on Results Page
(1) Scoring Function
The scoring function used is RTMScore.
(2) Advanced Filtering
Advanced filtering provides range filters to further narrow down molecules whose scores fall within a specified range, thereby excluding molecules that do not meet expectations.
(3) Rescoring Function Description/Sorting
Hover the mouse over the rescoring function name to view its description. Click the function name (e.g., RTMScore) to reorder by its score; click once for ascending order, again for descending, and a third time to revert to the original order.
(4) Show/Hide Columns
You can show or hide calculated columns and user-uploaded columns.
(5) Save/Download
Click "Save/Download" and a dropdown will appear to let you choose the file format (currently supports .csv/.sdf). After confirming your chosen format, you can set the save/download range, including: checked rows (molecules selected in the first column checkboxes of the table), filtered rows (molecules yielded by advanced filtering), all rows (all molecules), current visible columns (columns currently shown), or all columns (including both visible and hidden columns). The system will save data to the data center according to your settings, or download data to your local device.
(6) Parameters
Displays the parameters used for calculation in this task.
(7) Valid Results
Shows the number of currently displayed molecules (i.e., molecules obtained after advanced filtering on the current page) / total number of molecules.
4. Algorithm Overview
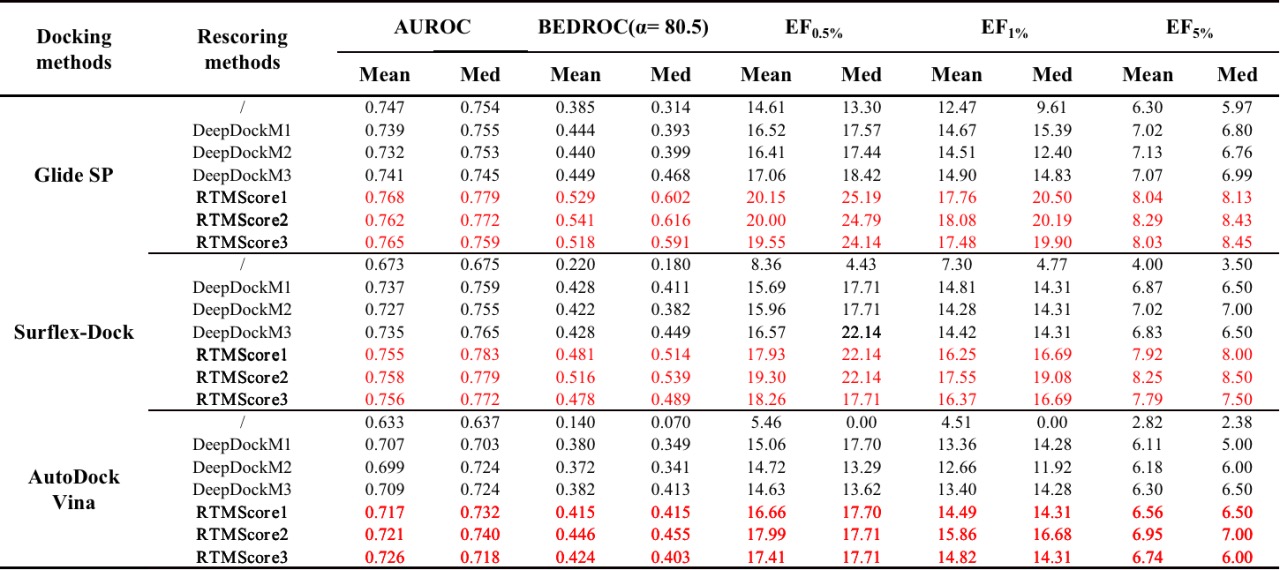
RTMScore is a novel scoring function for predicting protein-ligand binding affinity. We use Graph Transformer to extract residue features from proteins and atom node features from ligands and employ a Mixture Density Network (MDN) to obtain probability density distributions over pairwise distances between protein residues and ligand atoms. These are then transformed into statistical potentials to evaluate the binding strength between proteins and ligands. Results demonstrate that RTMScore significantly outperforms other mainstream methods in both docking and screening capabilities on the CASF-2016 benchmark dataset, achieving average top-1 docking success rates of 97.3% and 93.4% with and without native conformations, respectively (compared with only 87.0% for DeepDock and PIGNet without native conformations). For screening, RTMScore attains a 66.7% average top-1 success rate and a 1% enrichment factor (EF1%) of 28.00 (DeepDock and PIGNet record 55.4%, 19.60 and 43.9%, 16.41 for these metrics, respectively). We further evaluated RTMScore's screening ability on the DEKOIS2.0 dataset, where its enrichment was found to be notably better than that achieved by DeepDock (built with similar strategies) and the classical Glide SP method (see reference [1] for details).
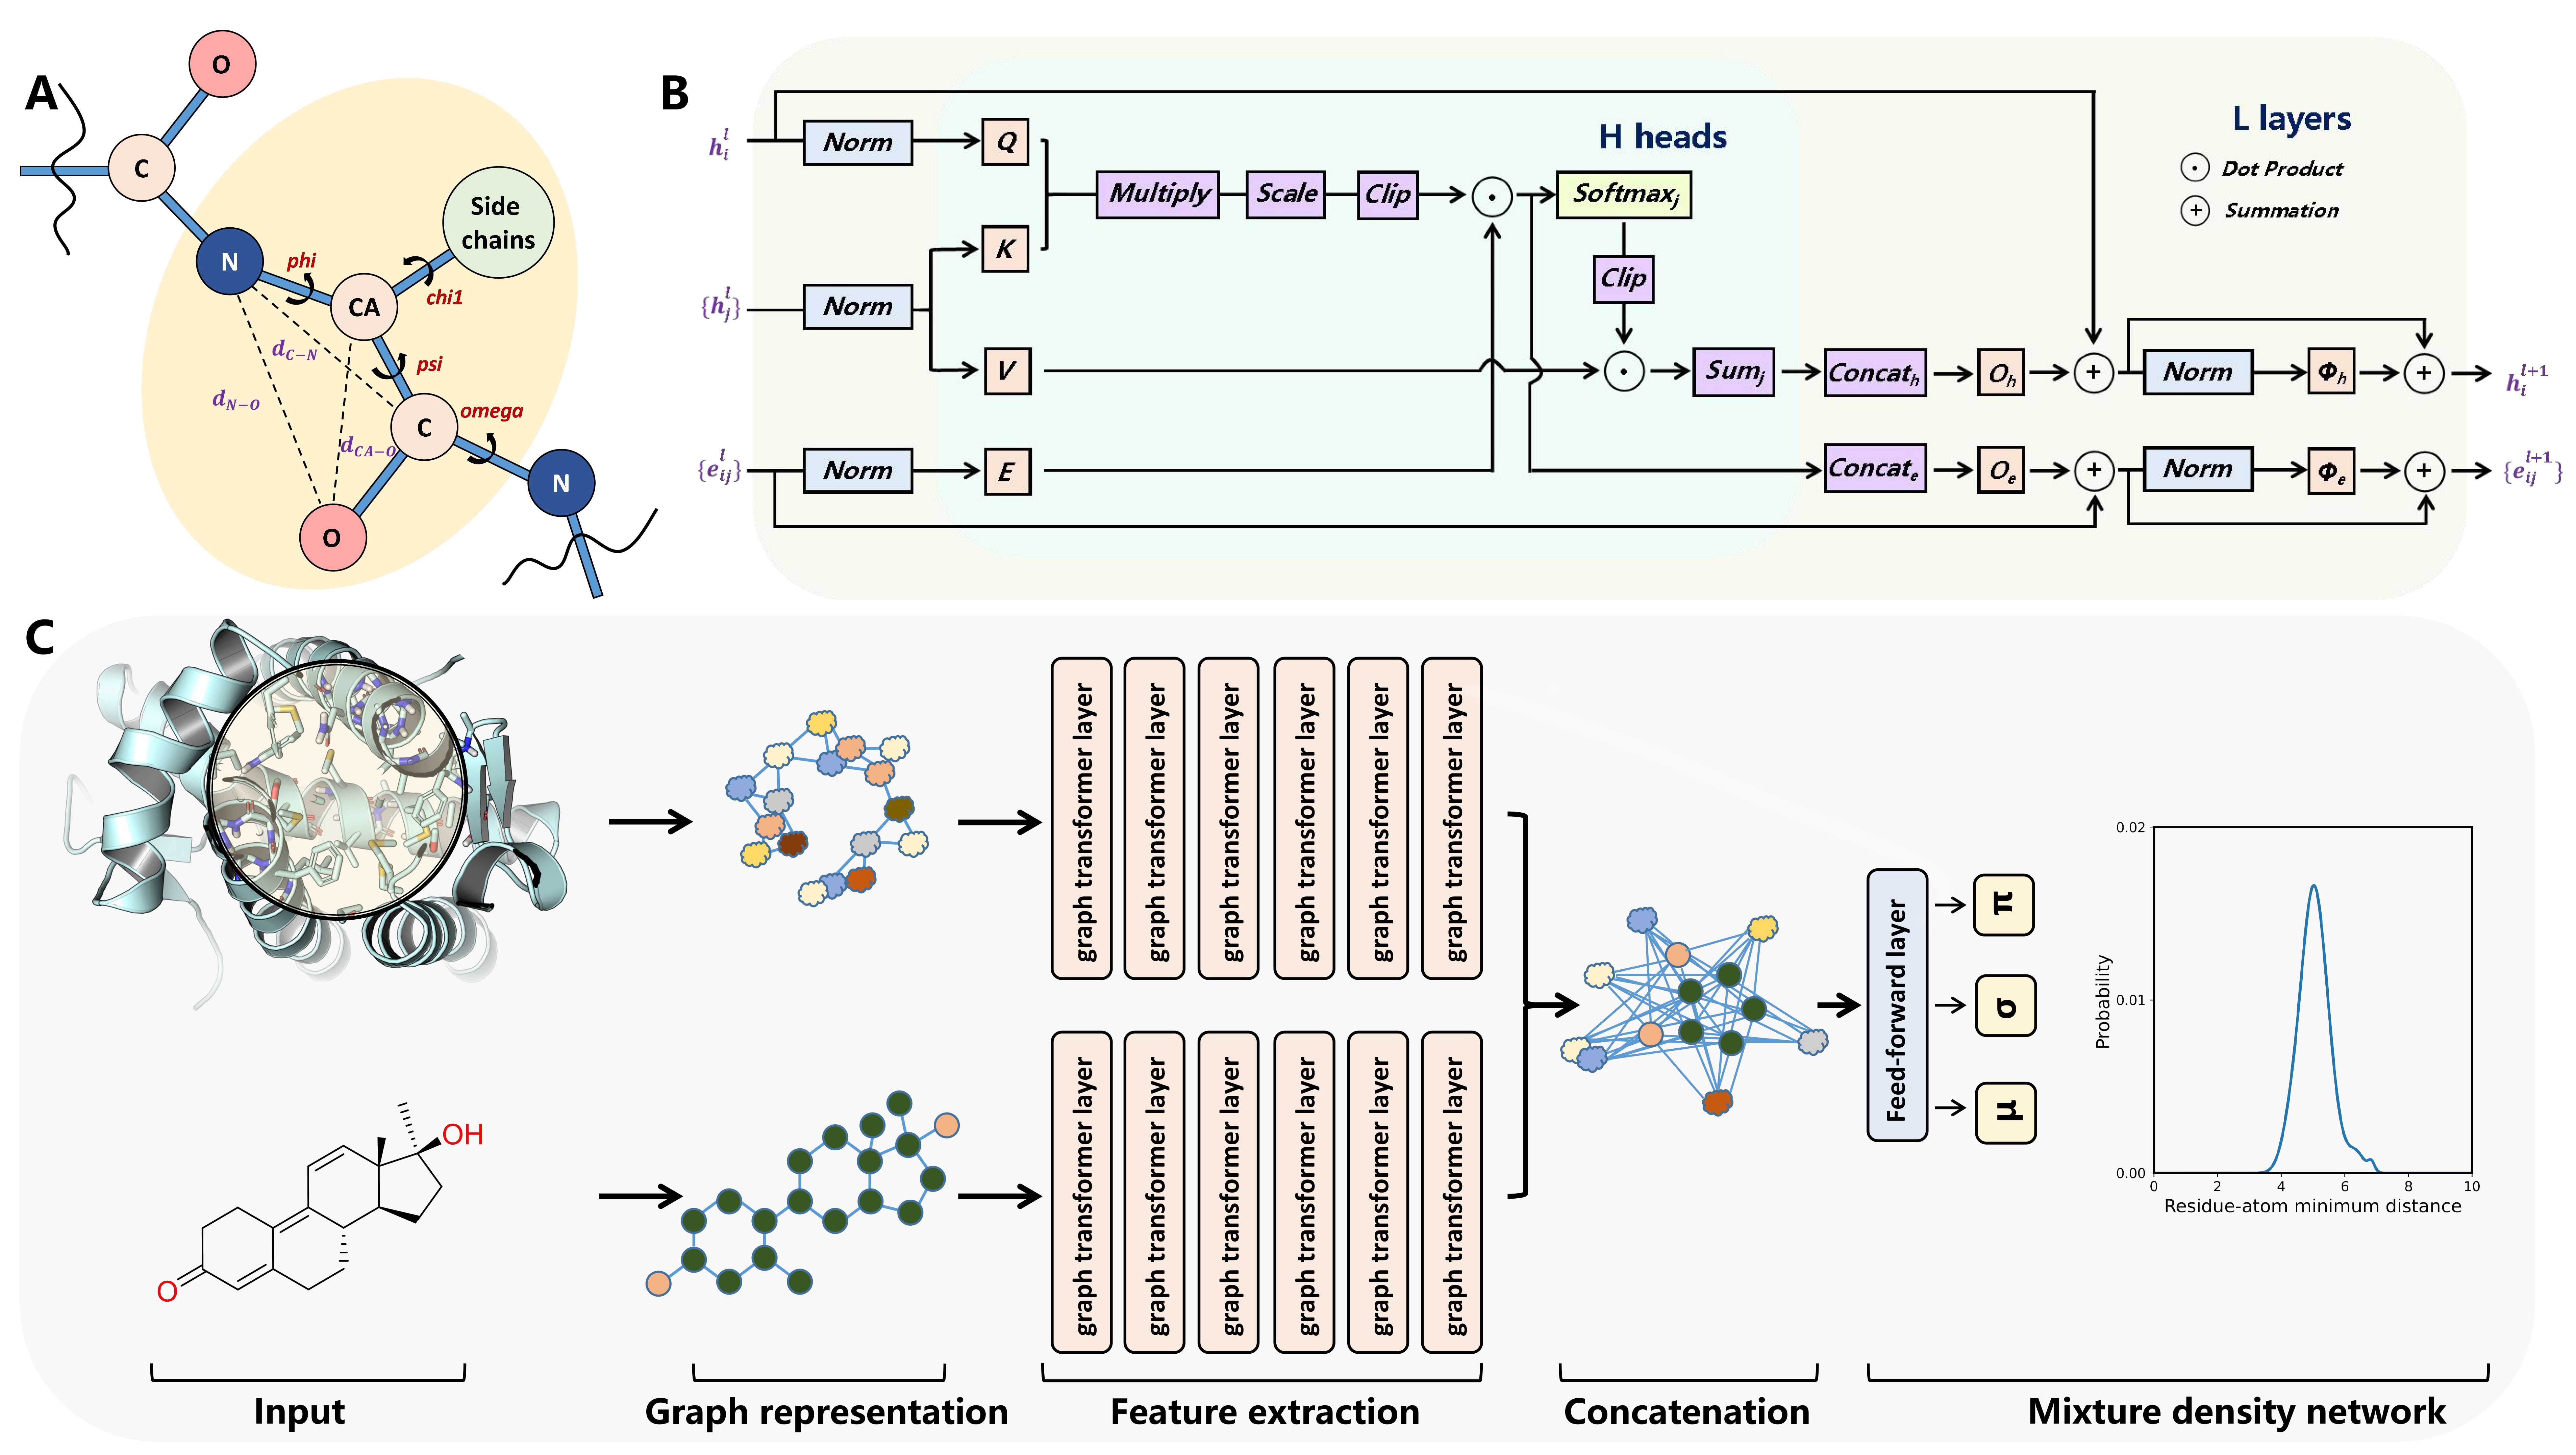
Figure 4. RTMScore model architecture
Table 1. Comparison of docking and screening performance of RTMScore versus other advanced methods on CASF-2016 benchmark
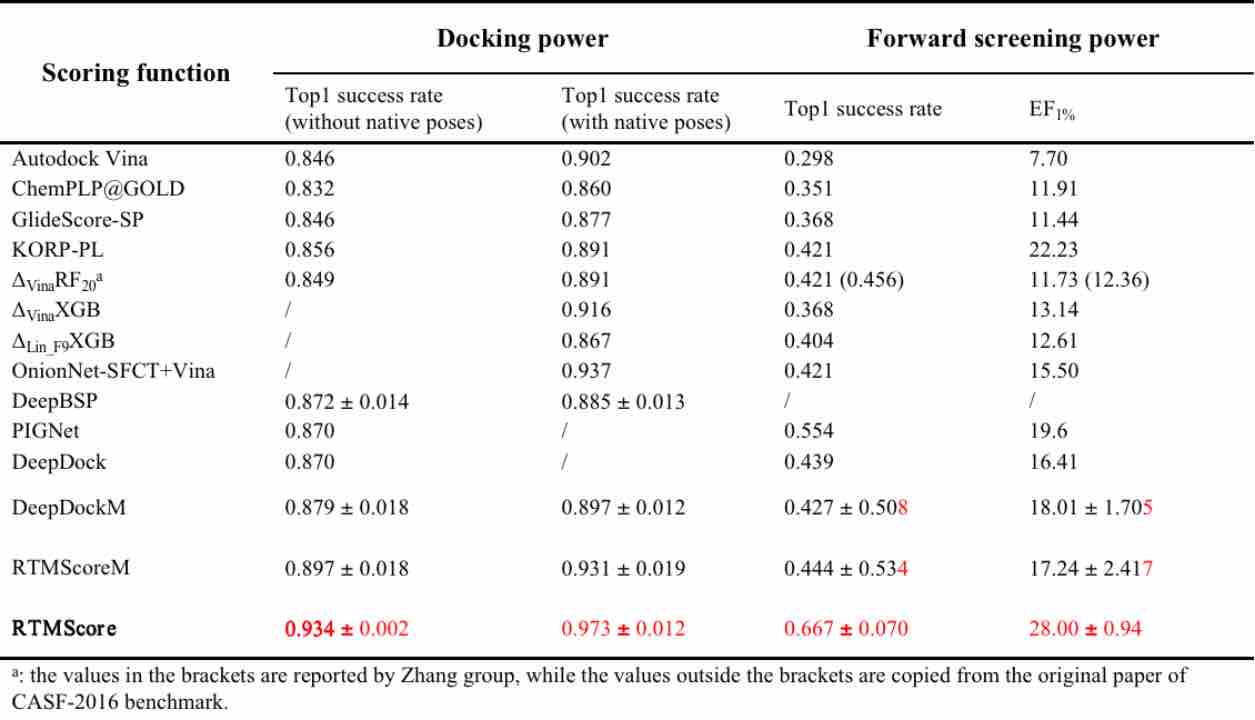
Table 2. Screening performance evaluation of RTMScore on the DEKOIS2.0 dataset
5. References
[1] Boosting Protein-Ligand Binding Pose Prediction and Virtual Screening Based on Residue−Atom Distance Likelihood Potential and Graph Transformer, Journal of Medicinal Chemistry, 2022, 65, 10691-10706.