NMR Parsing
1. Overview of NMR Parsing
Structure elucidation of unknown compounds based on nuclear magnetic resonance (NMR) is one of the inverse problems that remain challenging in chemical science. Finding new methods to tackle the inverse problem of structure elucidation will aid researchers in accelerating chemical discovery, especially for the research of organic chemistry and natural product chemistry. AI assisted Structure Elucidation module mainly applies AI technology to quickly analyze carbon spectrum and help experts identify molecular structure. Here, we provide two different methods including CReSS and CMGNet to elucidate the structure of unknown compounds.
2. Instructions for Use
The platform provides two method of spectrum analysis: CReSS and CMGNet. After completing the input according to the selected method, you need to name the task in the "Task Name" text box, and click the "Submit" button to enter the background calculation step.
(1) CRESS
Select "CReSS" in the check box and enter the 13C NMR chemical shift values in the text box.
Note: Solvent peak need to be removed in advance.
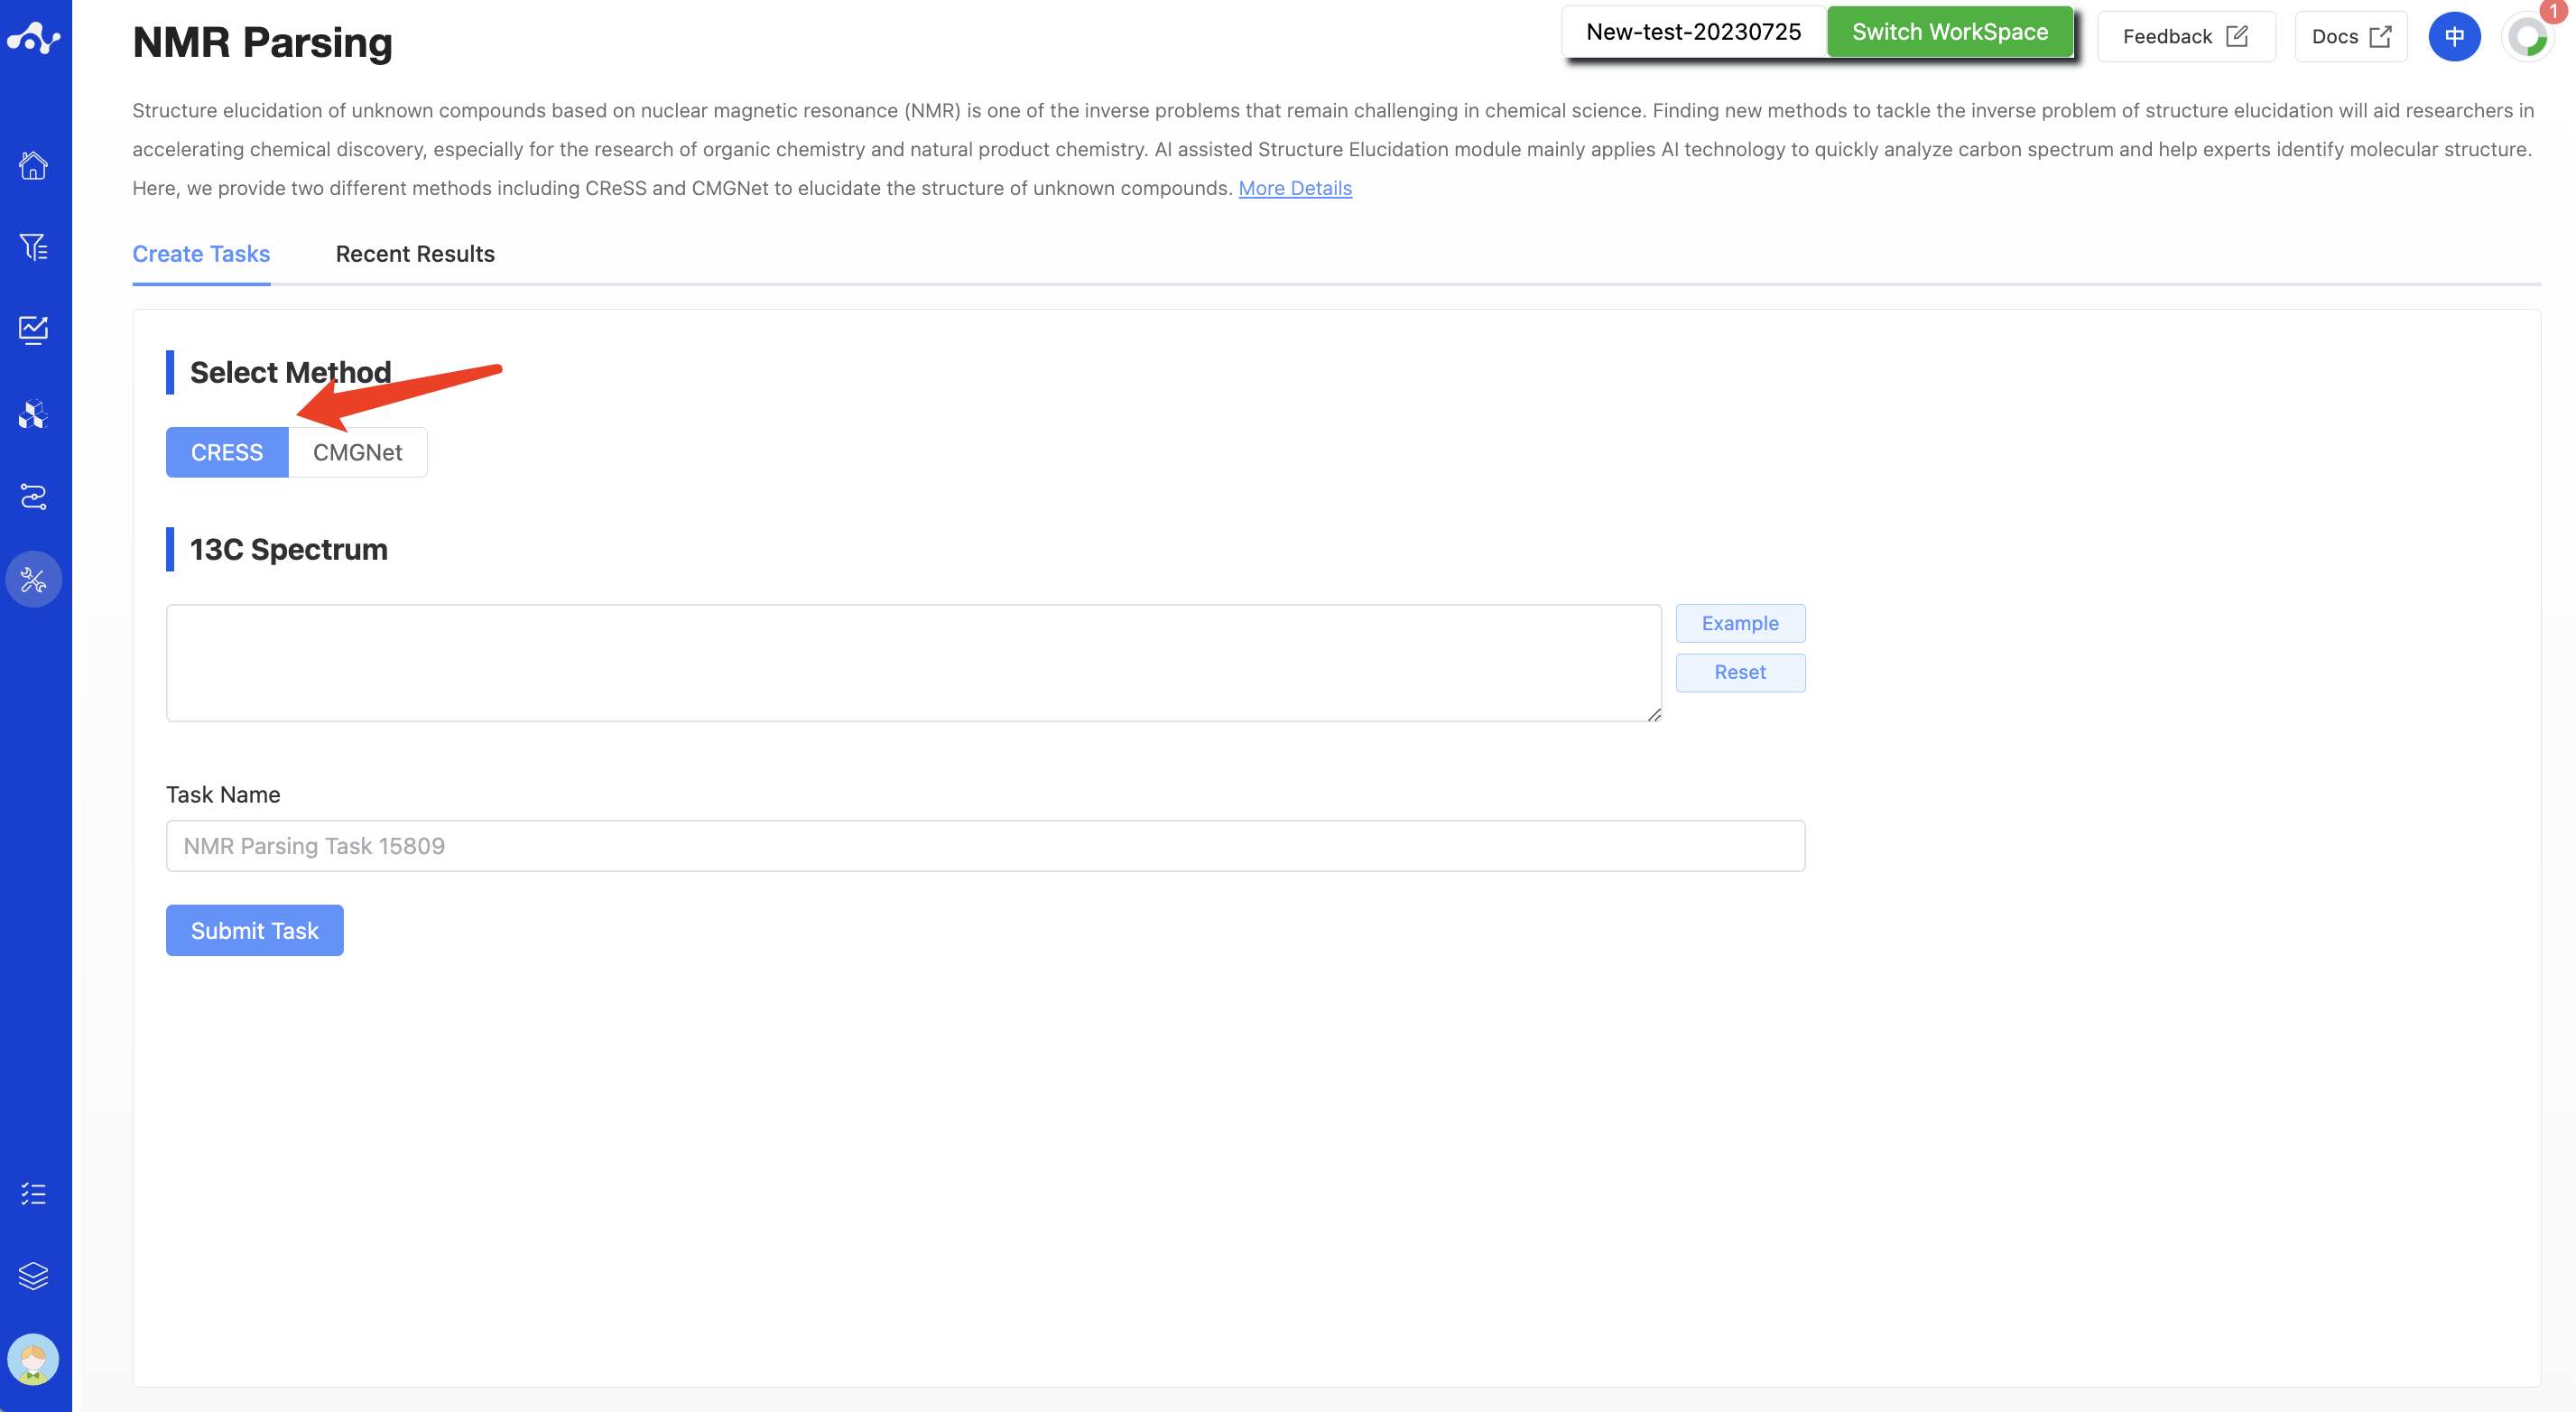
Figure 1. The page of create CRESS task.
(2) CMGNet
Select "CMGNet" in the check box and enter the 13C NMR chemical shift values in the text box(remove solvent peak in advance). Unlike CReSS, CMGNet can selectively input the other two items:
The molecular formula. If you already know the molecule formula by High Resolution Mass spectrometry or other analytical techniques, you can enter it to the text box.
The SMILES of the identified molecular fragment. ➀If you have resolved several simple fragments through any other techniques, their SMILES can also be entered into the text box, and enter multiple SMILES in the form of newline. ➁If you only know the fragment structure but not SMILES, you can draw the fragment in the molecular editing area. After drawing the fragment, click the SEND button next to SMILES to input SMILES into the text box, and then draw the second molecule after clearing the editor, and so on.
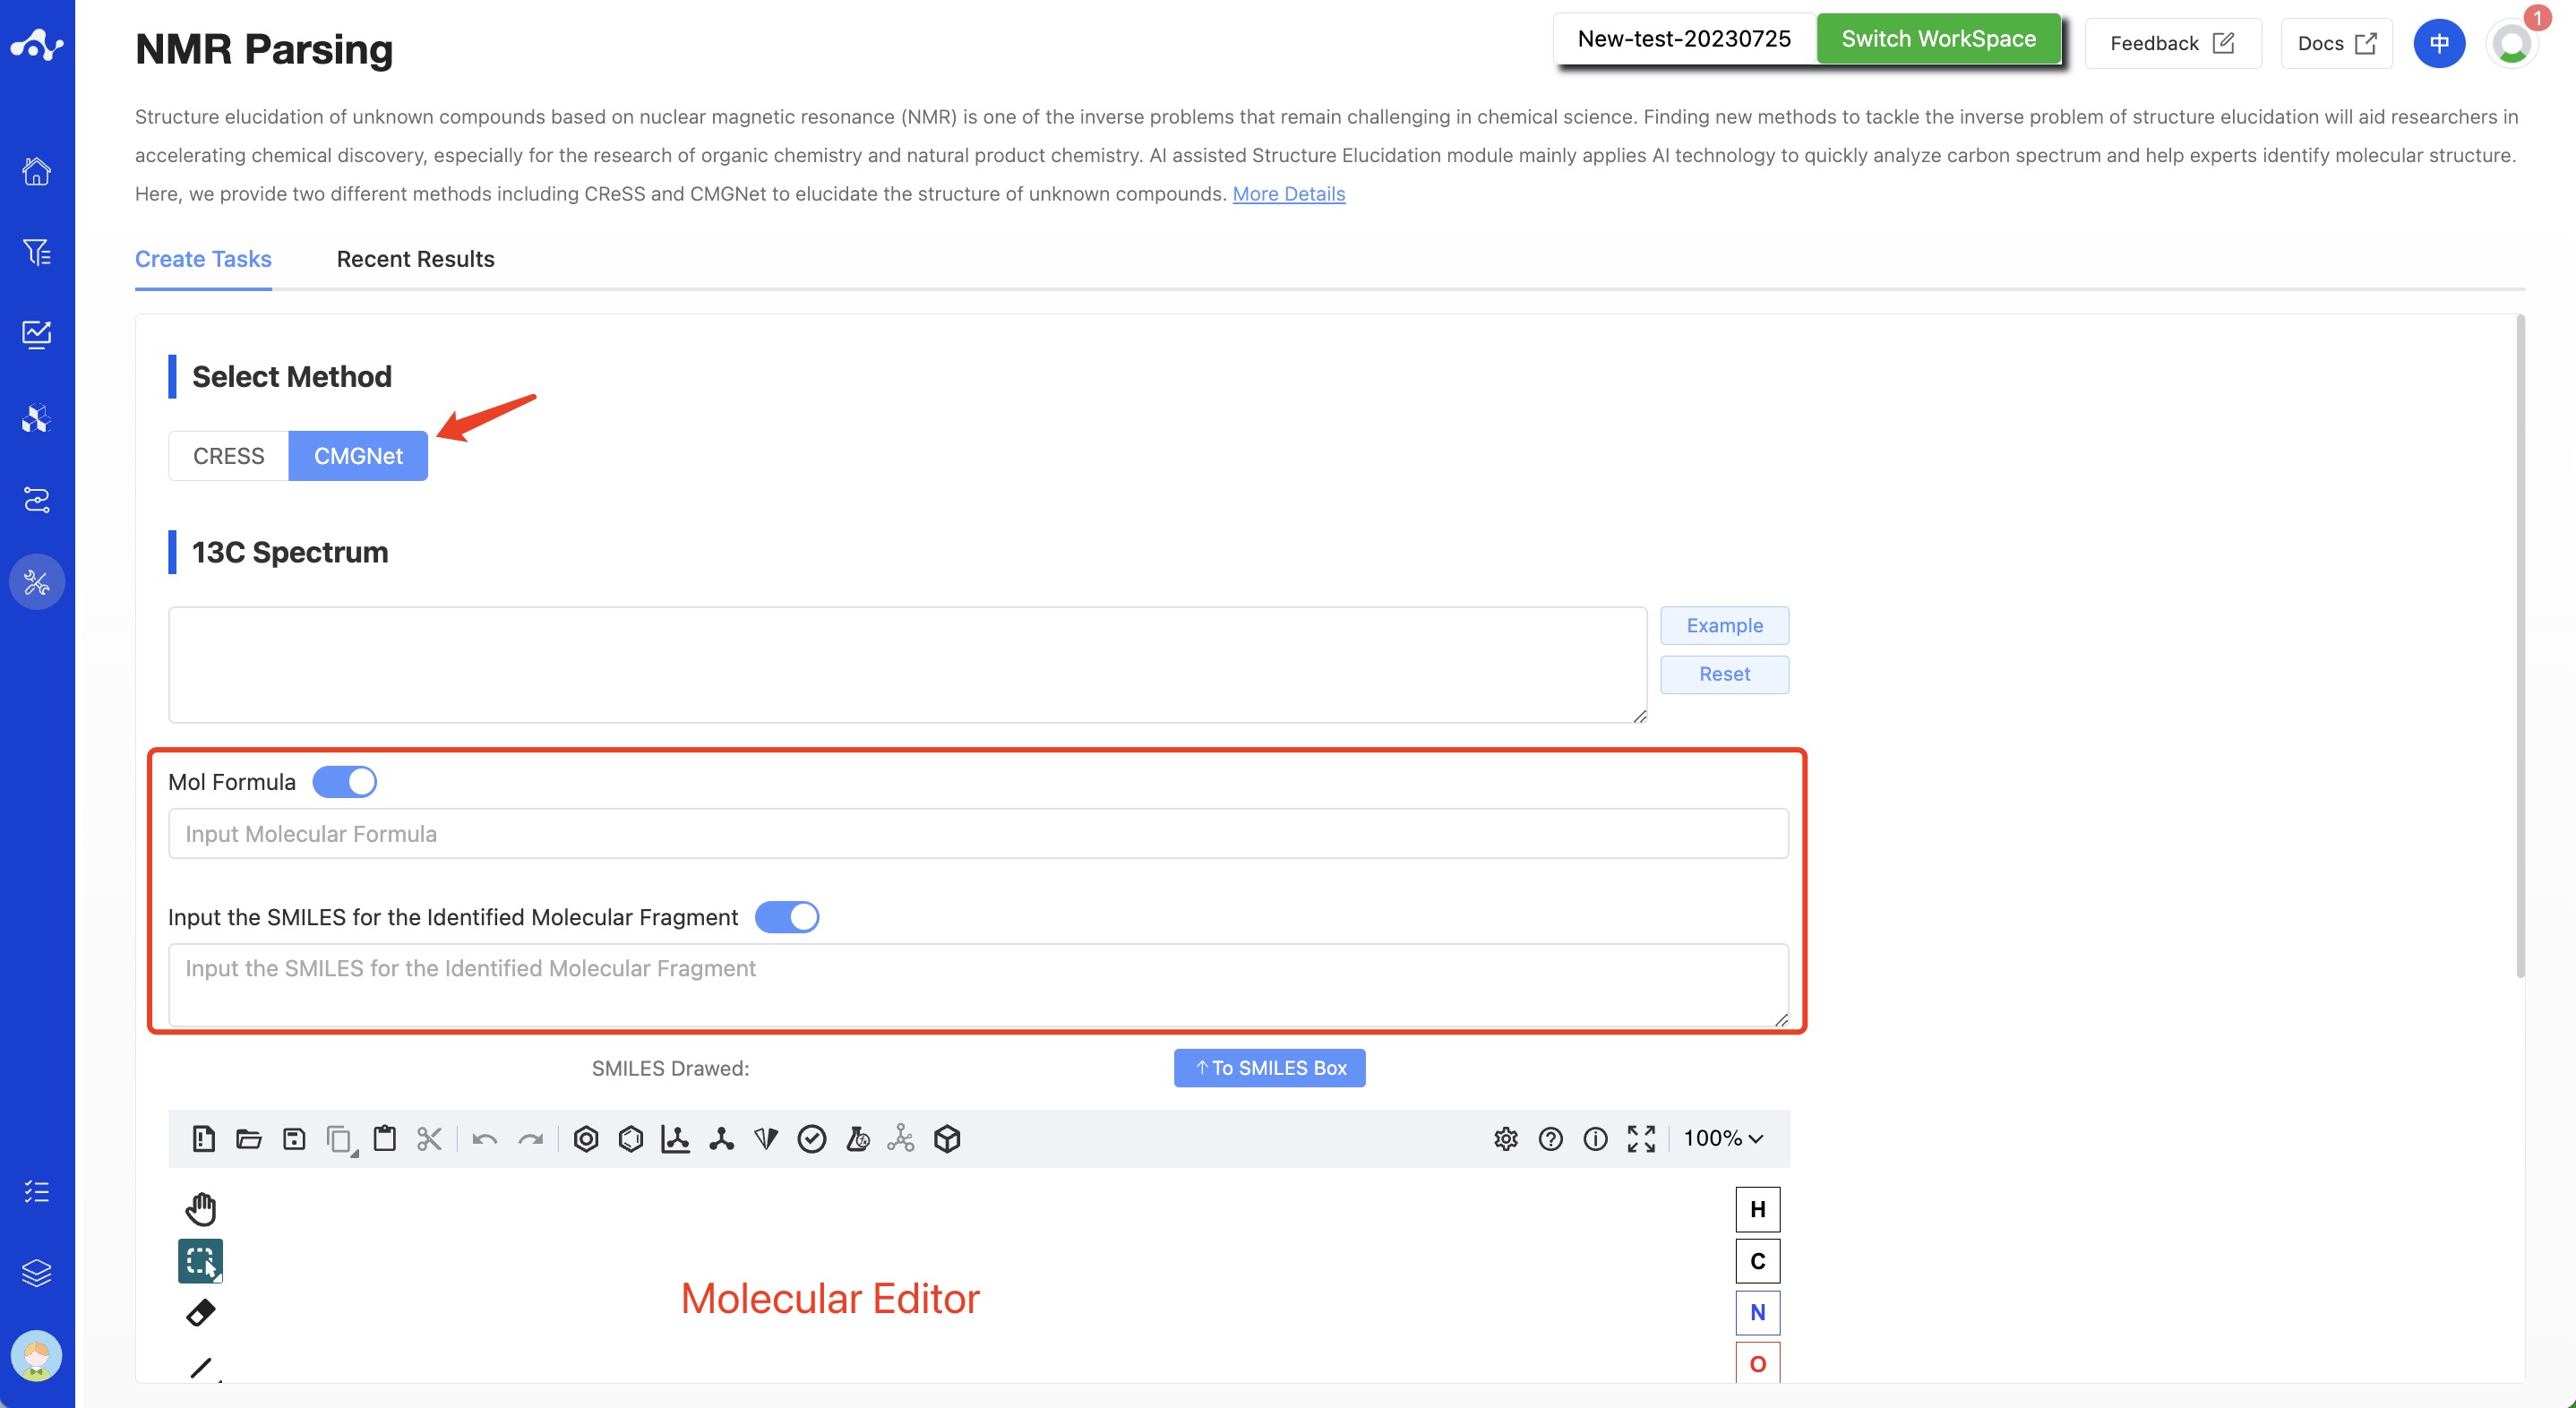
Figure 2. The page of create CMGNet task.
(3) Running Sataus and View Results
After the task is submitted, the page will automatically jump to the "Recent Results" subpage of the current page. Here you can view the task running status of the current module (progress bar), and you can also view all running tasks of all modules in the "Running" dropdown box in the upper right corner. Once the task is complete, a card will pop up in the top right corner of the page to notify you that a new task has been completed. You can click the "View Results" button in the card to view the results, or click the "Result Details" button on the current "View Results" page to view the results.
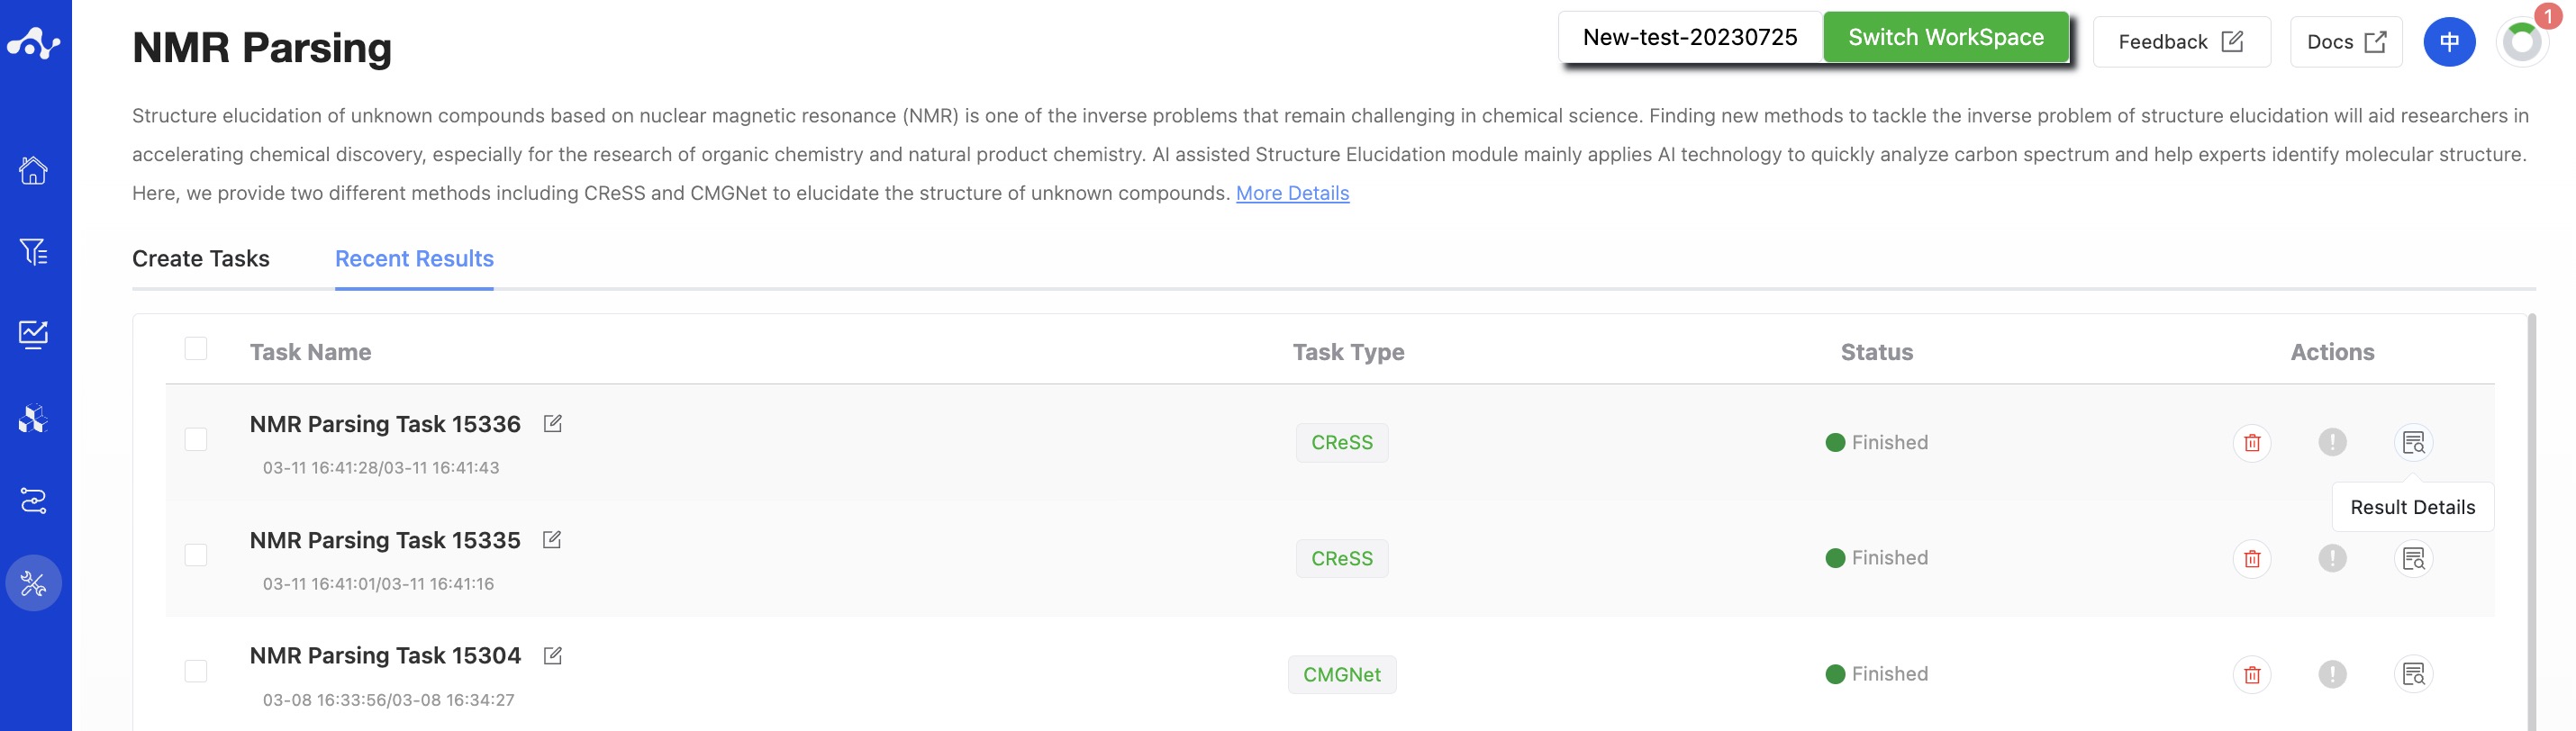
Figure 3. View Results
3. Results Analysis
The results page consists of a Summary at the top and a results detail area in the middle. By default, the result details area displays the list subpage (you can also switch cards subpages), where you can view the molecule structure and several prediction properties , and sort and filter these properties. Meanwhile,the predicted results are assigned a color to help you visualize the data. The results page for CReSS and CMGNet is slightly different.
CRESS: When you choose to use CRESS calculations, there is a calculated cosine Similarity score between your input 13C NMR feature extracted by NMR encoder of CReSS and the SMILES features extracted by SMILES encoder of CReSS and pre-stored in the molecular structure library, and the results are sorted in descending order of their cosine Similarity score.
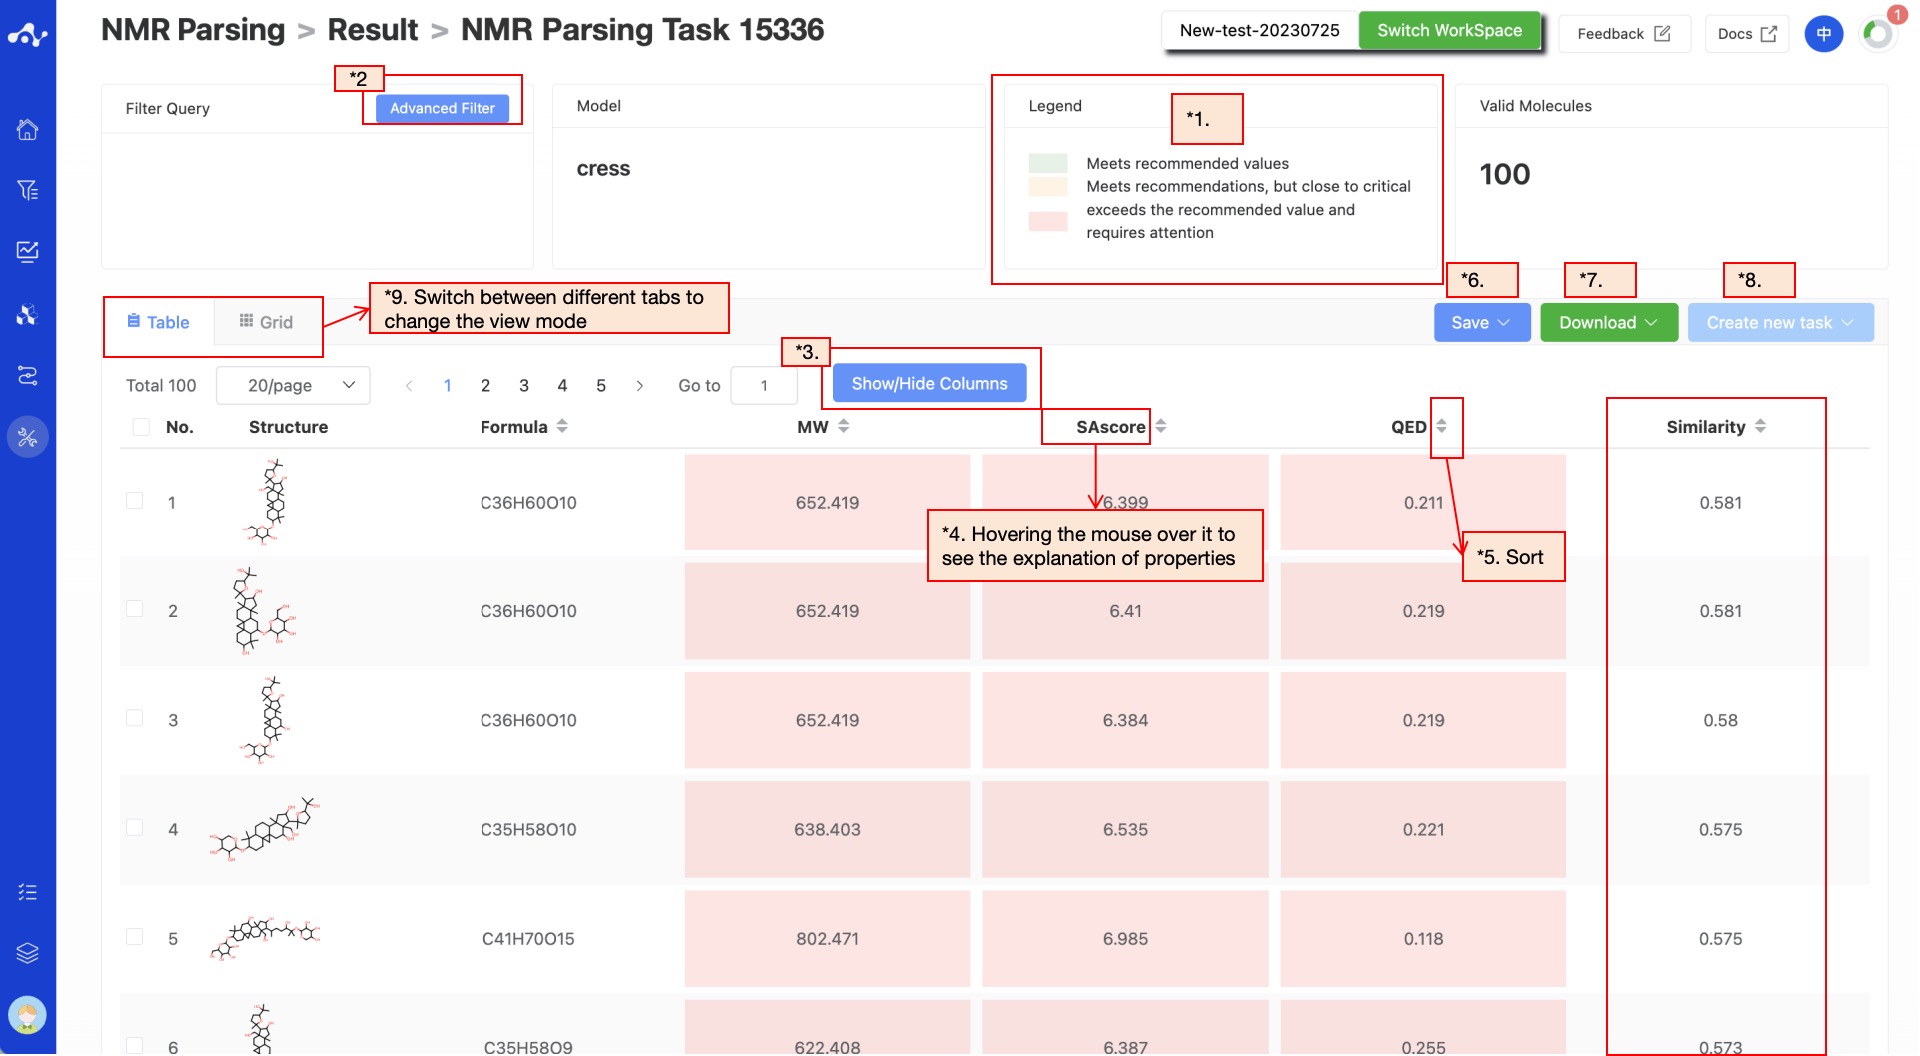
Figure 4. The result page of CRESS.
CMGNet: Unlike CReSS, CMGNet does not provide this cosine similarity score, but reflects this information through molecular ranking. In other words, for CMGNet, the higher the molecular ranking, the higher the confidence.
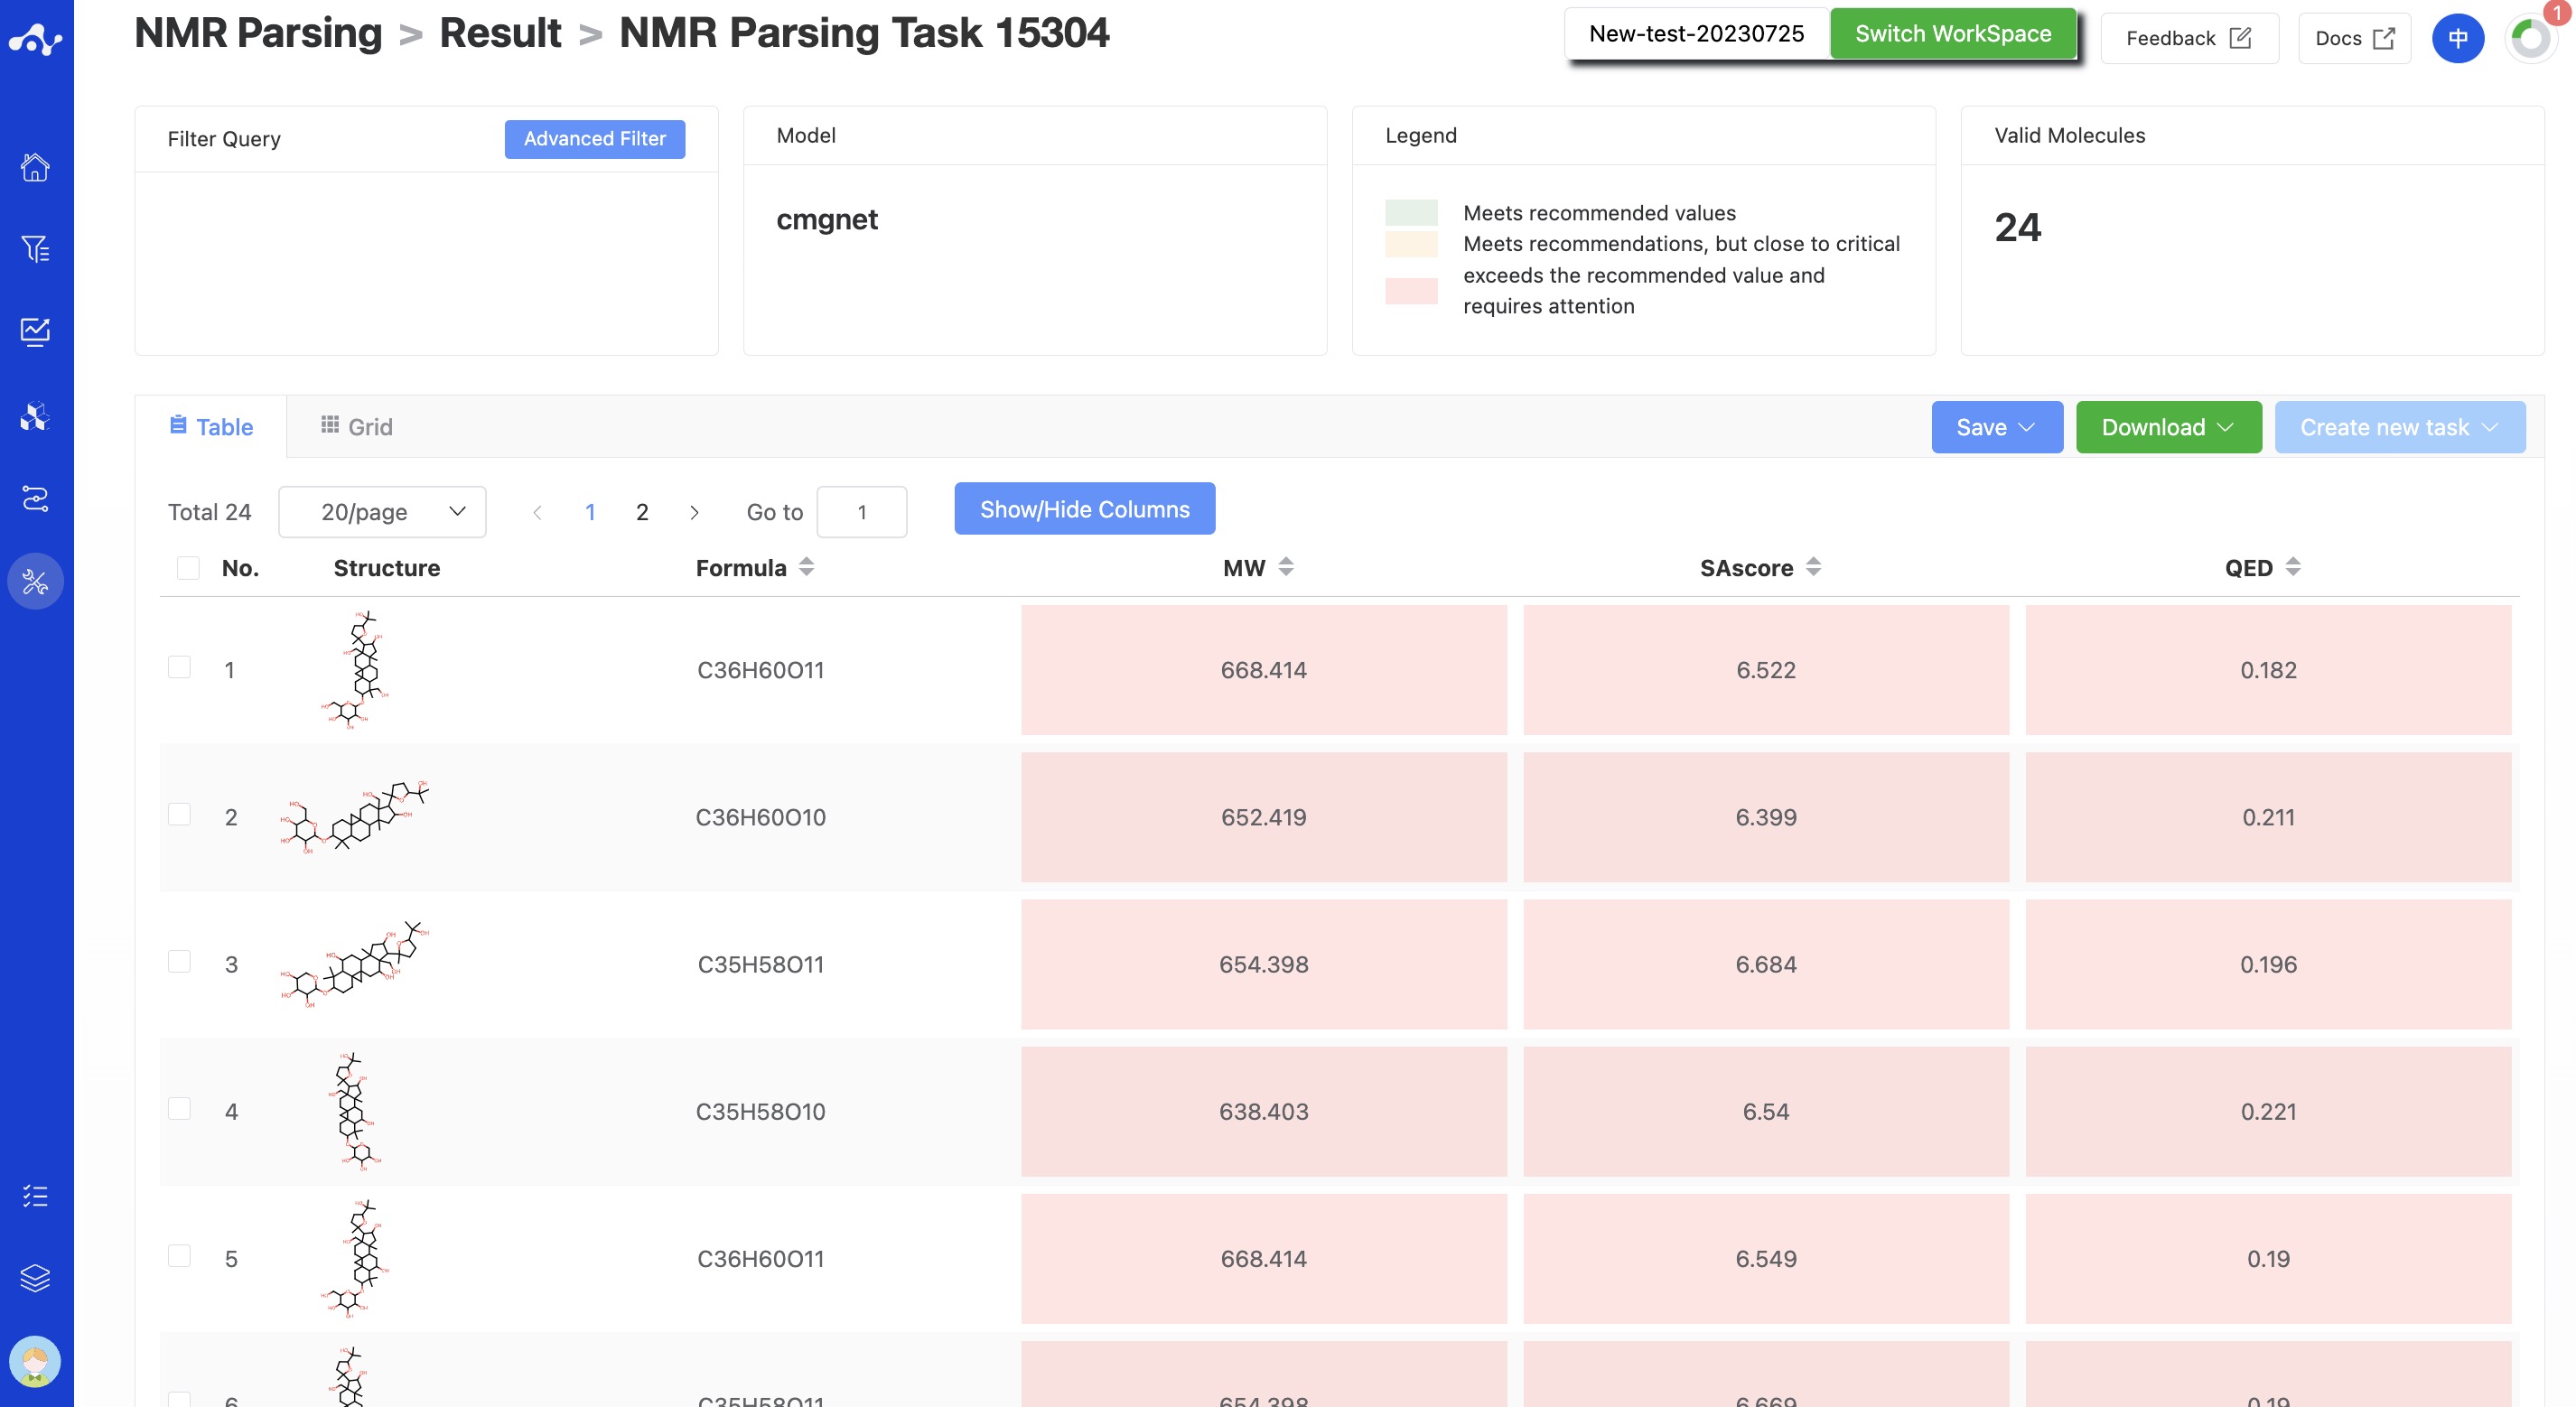
Figure 5. The result page of CMGNet.
(1) Definition of Color
Since different properties have different suggested value ranges, we made an intuitive evaluation of the prediction results by color. The rules for color setting are as follows:
- For properties where the predicted result is between 0-1:
P≤0.5, the background color of the value is green, which means that the predicted compound does not belong to this category;
05<P<0.7, the background color of the value is yellow, indicating that the predicted compound may belong to this category;
P≥0.7, the background color of the value is red, indicating that the predicted compound is likely to be this category.
- For properties with optimal intervals, such as:
The optimal value of Fsp3 is Fsp3 ≥ 0.42, and two colors are defined, those that meet the threshold are green, and those that do not meet the threshold are red;
The optimal interval of Log S is -4~0.5, and two colors are defined, those within the interval are green, and those beyond the interval are red;
There are three definitions for the value of QED: Attractive: > 0.67; unattractive: 0.49-0.67; too complex: < 0.34, according to this definition, red, green and yellow can be assigned.
(2) Advanced Filtering
Advanced filtering provides range filtering, which can further filter out molecules within a specified range of certain properties to exclude molecules that do not meet the expected results. After advanced filtering, only molecules that meet the filter conditions will be displayed on the page.
(3) Show/Hide Upload Column
The default result list does not display information in the uploaded file, so it is unselected in the left control bar. When you don't want to display this property, deselect it, and the result list on the left will show in real time based on the selection in the control bar. At the top, there are also two shortcuts "Select All" and "Deselect", which are convenient for users to quickly select.
(4) Property Explanation
Hover the mouse over the name of each property to view the interpretation of the corresponding attribute.
(5) Sorting
Click the property name in the result list to reorder. For example, F(20%), click once for ascending order, click again for descending order, and click a third time to restore the original order.
(6) Save
Click "Save", and the system will pop up a dropdown box for you to choose the file format to save (currently only supports .csv/.sdf). Once you have determined the style of the file to save, save the corresponding data to the data center as a sdf or csv file. The saved content is the molecules of the effective number displayed on the page, which are usually obtained according to your show/hide column conditions, advanced filtering conditions, favorites, or dislikes.
(7) Download
Click "Download", and the system will pop up a dropdown box for you to choose the file format to download (currently only supports .csv/.sdf). After determining the style of the file to download, the system will download the corresponding data to your local device as a sdf or csv file. The content downloaded is consistent with the save method, which also downloads the molecules of the effective number displayed on the page, which are usually obtained based on your show/hide column conditions, advanced filtering conditions, favorites, or dislikes.
(8) Create New Task
The prerequisite for creating a new task is to first save the data into a file. Before the save operation is performed, this button is disabled. As soon as the new file is saved based on the results, this button is enabled. When you click this button, the system will pop up a dropdown box for you to select the module to be calculated. After clicking, the page will immediately open a new tab and will take your saved dataset with it. After adjusting the parameters, you can submit a new task.
(9) Card Page
In the card page, we provide a more concise way to view the results, you can only see the structure of the molecule and its 3 basic properties: MW, SA and QED.
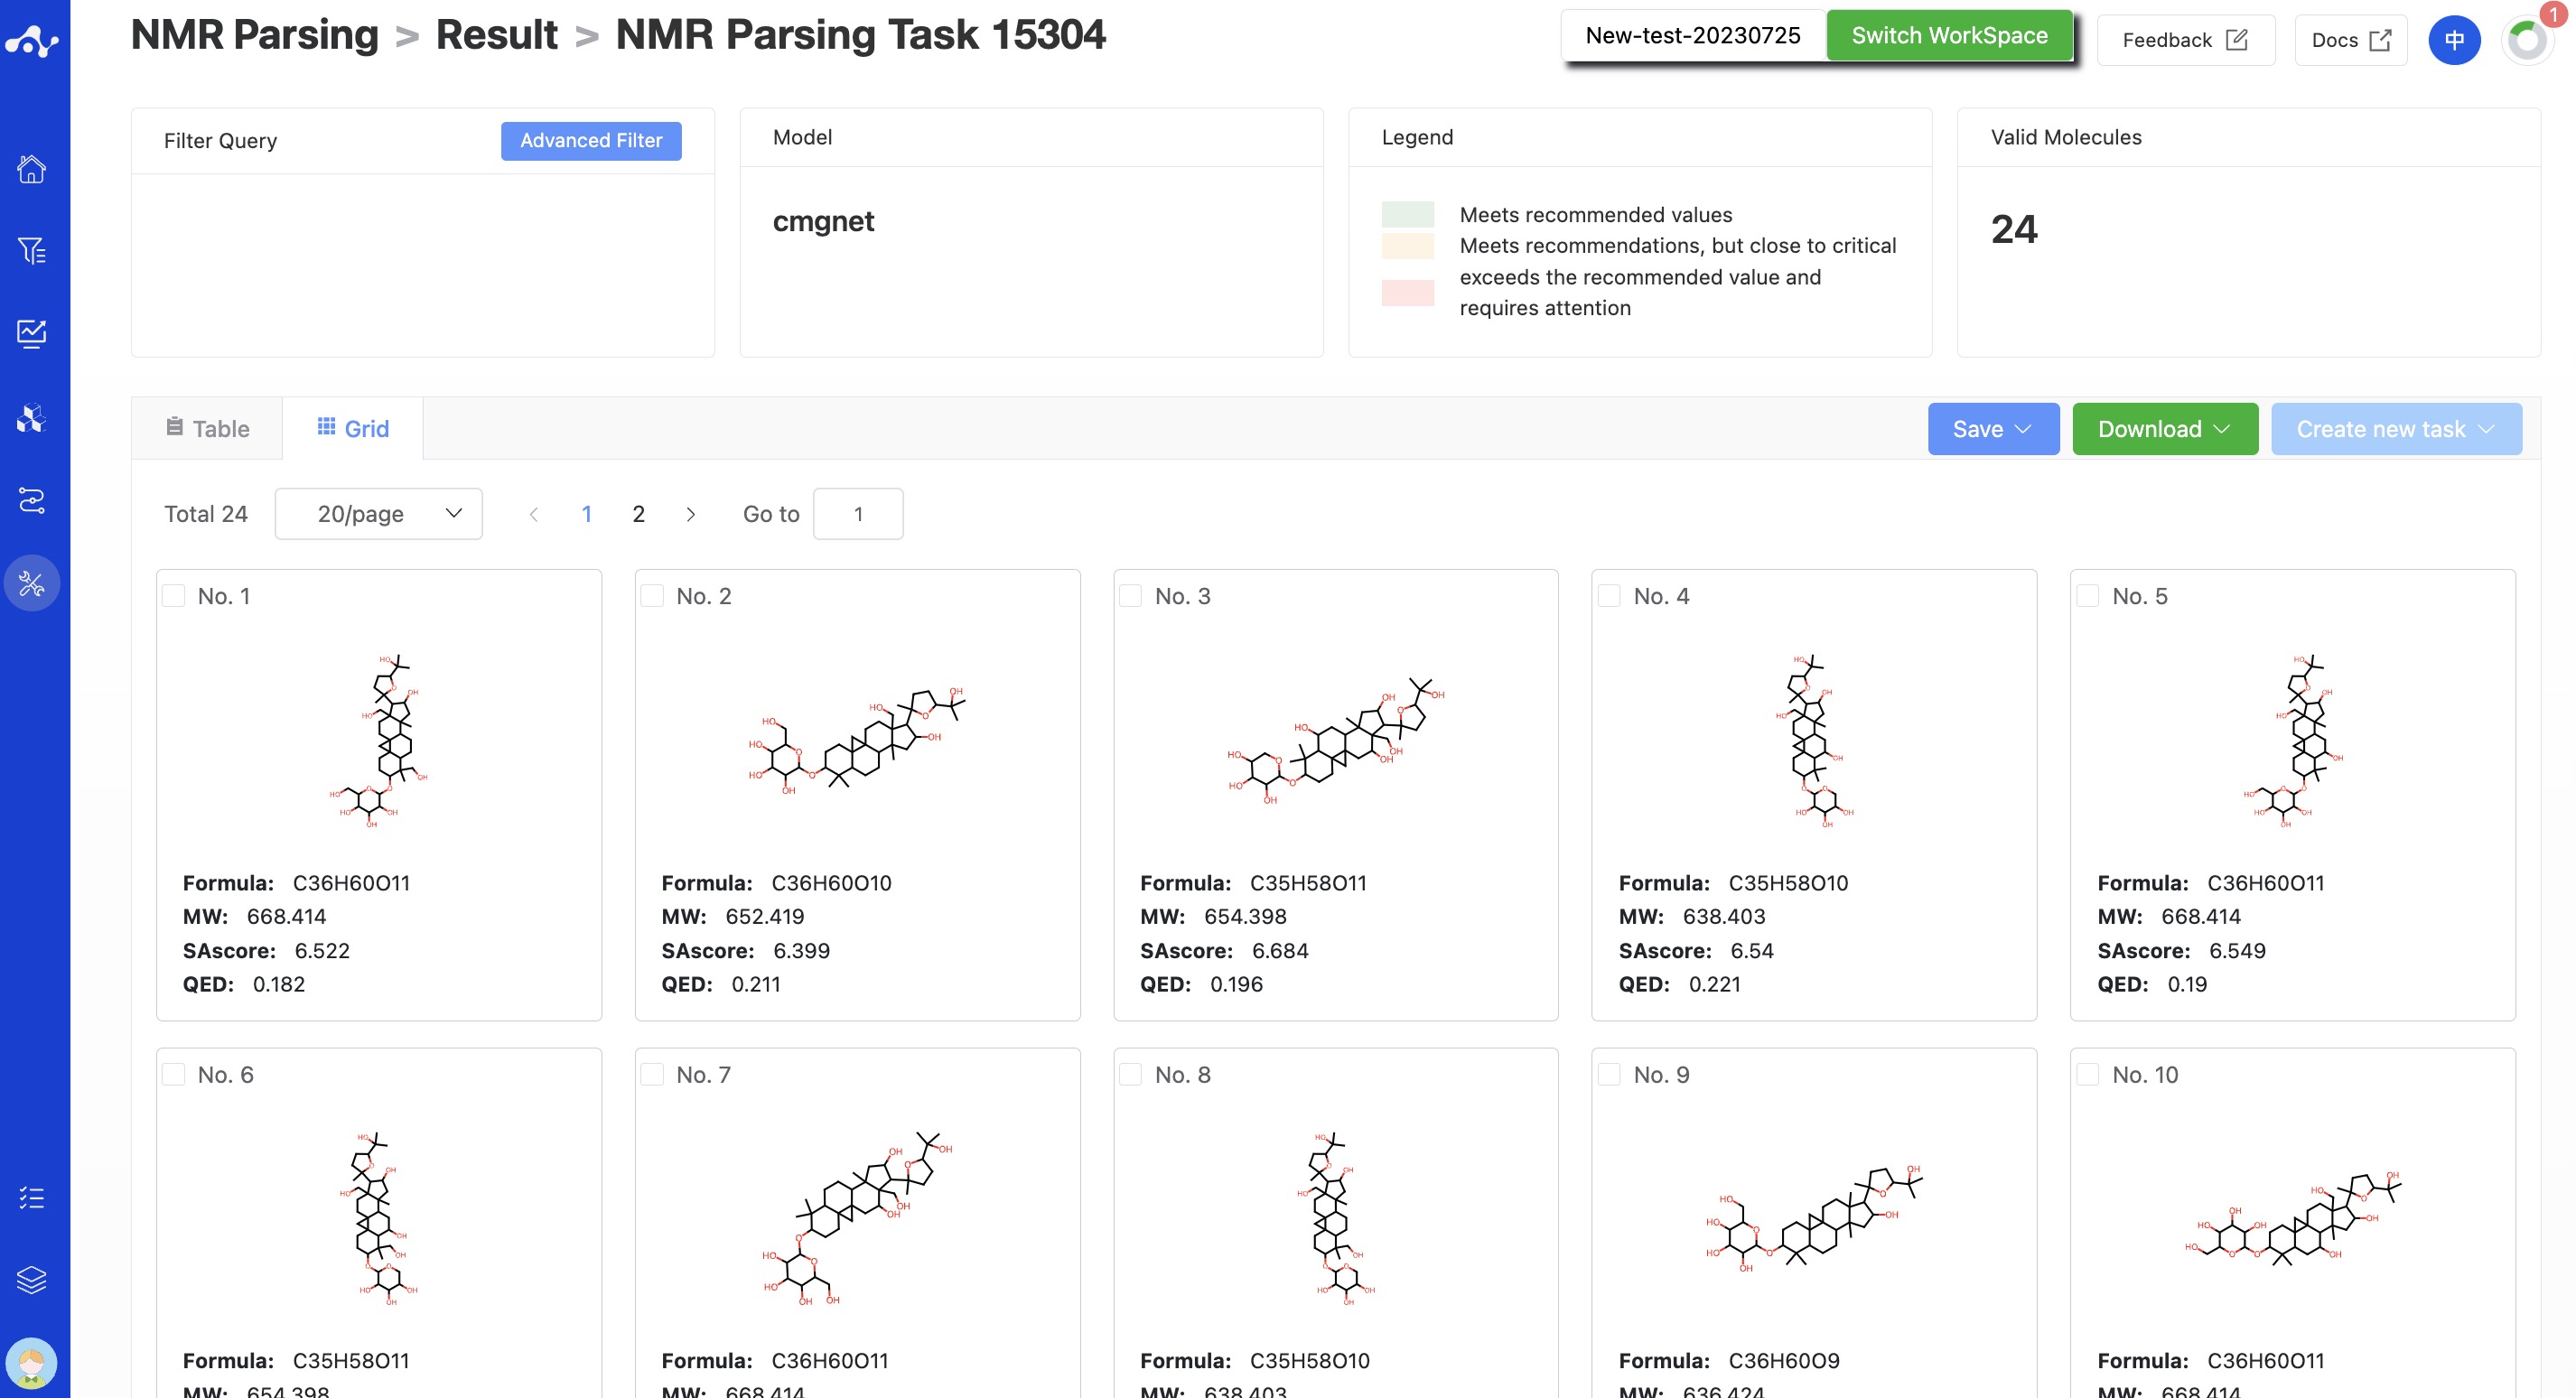
Figure 6. The grid subpage
4. Introduction to the Related Algorithm
(1) CReSS
CReSS is a cross-modal retrieval between spectrum and structure method based on deep contrastive learning. We introduce contrastive learning to train an NMR encoder and a SMILES encoder for learning the inherent relationship of spectral and structural to compare their similarity(Figure 1). Meanwhile, we construct a structure library containing tens of millions of molecules and its SMILES feature extracted by SMILES encoder, and allows us to search a molecular structure library using the 13C NMR spectrum of an unknown compound. Test results showed that CReSS have excellent performance in the task of identifying the structure of compounds based on 13C NMR spectral data, and can assist in structural elucidation and structural revision.
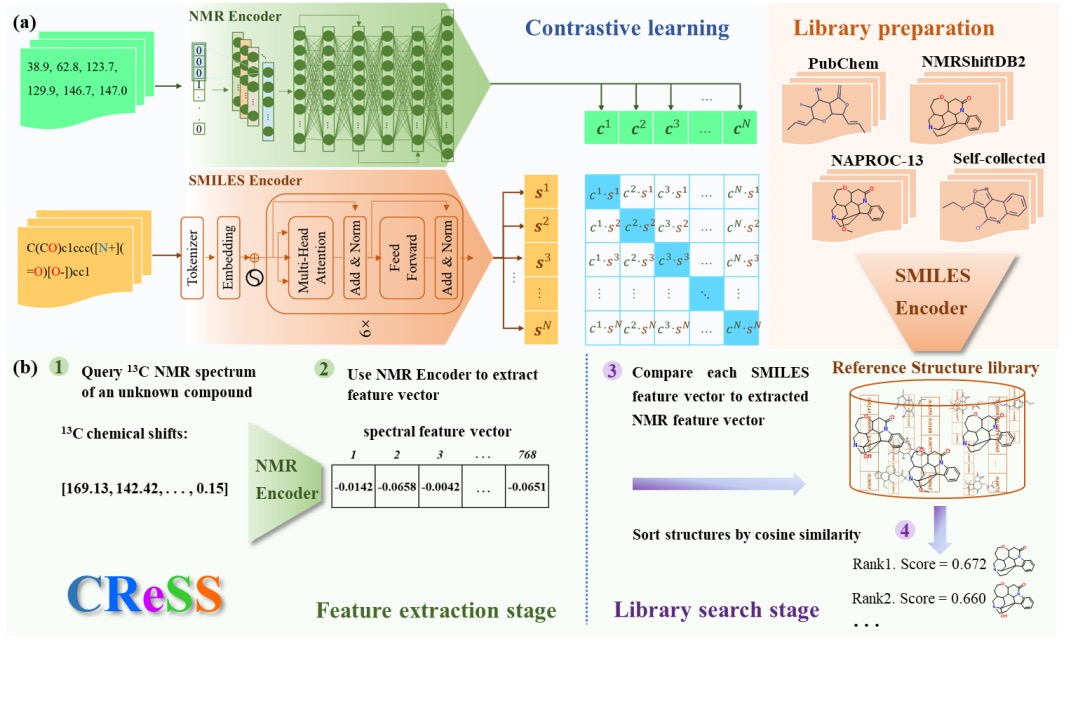
Figure 7. Cross-modality Carbon Spectrum-Structure Retrieval method. (a) Contrastive Learning (b) CReSS process
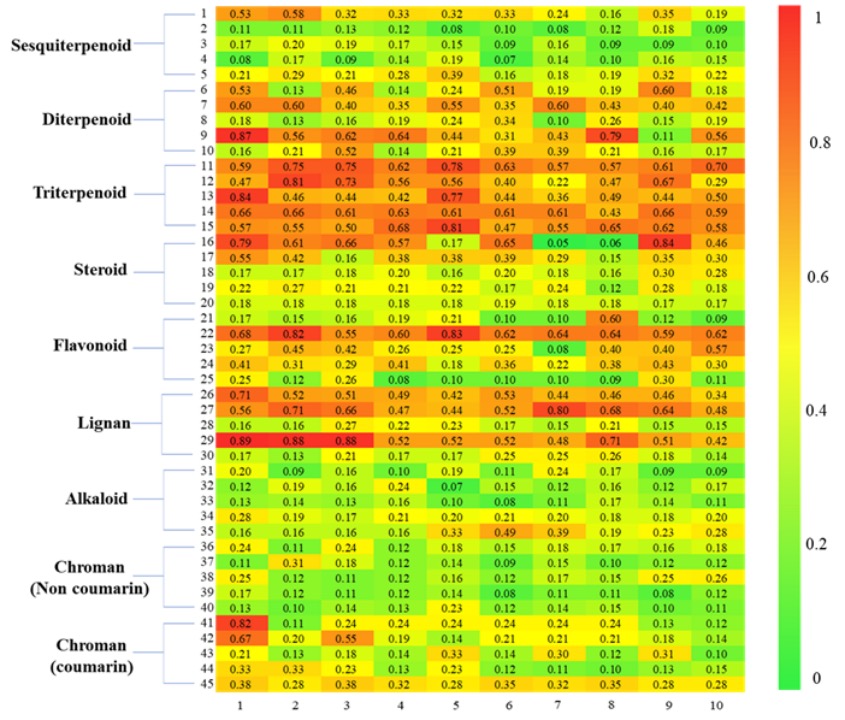
Figure 8. Heatmap of Tanimoto similarity between the correct structure of the "new compound" and the candidate structures retrieved by CReSS.
(2) CMGNet
CMGNet is a conditional generative model based on a bidirectional and autoregressive transformer (BART), which applies large-scale pre training technology on 360 million molecules for molecular understanding, and then, fine-tuning is performed on two NMR spectral datasets of different granularity levels to accommodate the downstream structure elucidation task. Compared to CReSS, CMGNet not only uses 13C NMR spectral data and molecular formulas as input, but fragments of molecules, which represent the prior knowledge of experts, are also employed to help elucidate structures, especially for large and complex molecules(Figure 3). CMGNet can generate candidate structures based only on 13C NMR data, and with the addition of molecular formula and fragment information, the top 10 recovery rates of the model reached 94.17%(Table 1). CMGNet learns both the inherent properties of molecules and the prior knowledge of experts and has a deeper understanding of the structure-property relationships, paving the way for a new paradigm of deep learning-assisted inverse problem solving.
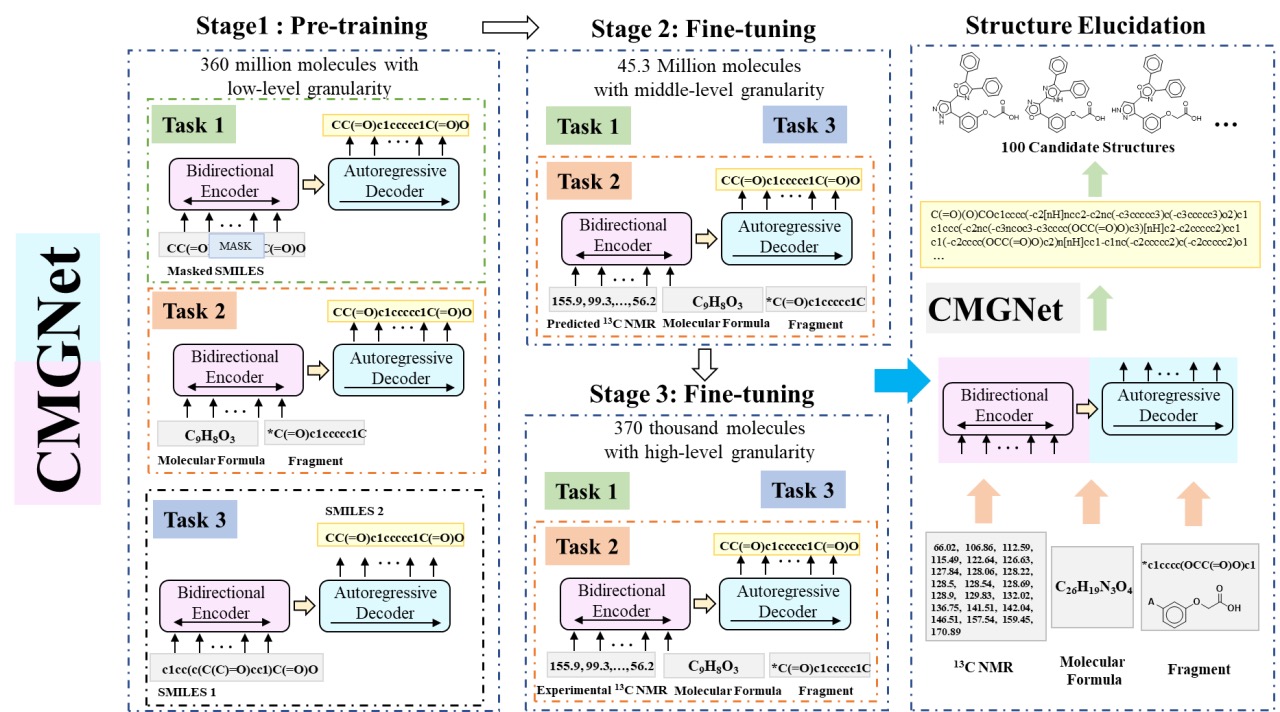
Figure 9. Workflow of CMGNet.
Table 1. Performance comparison of CMGNet with different constraints on the extra test set.
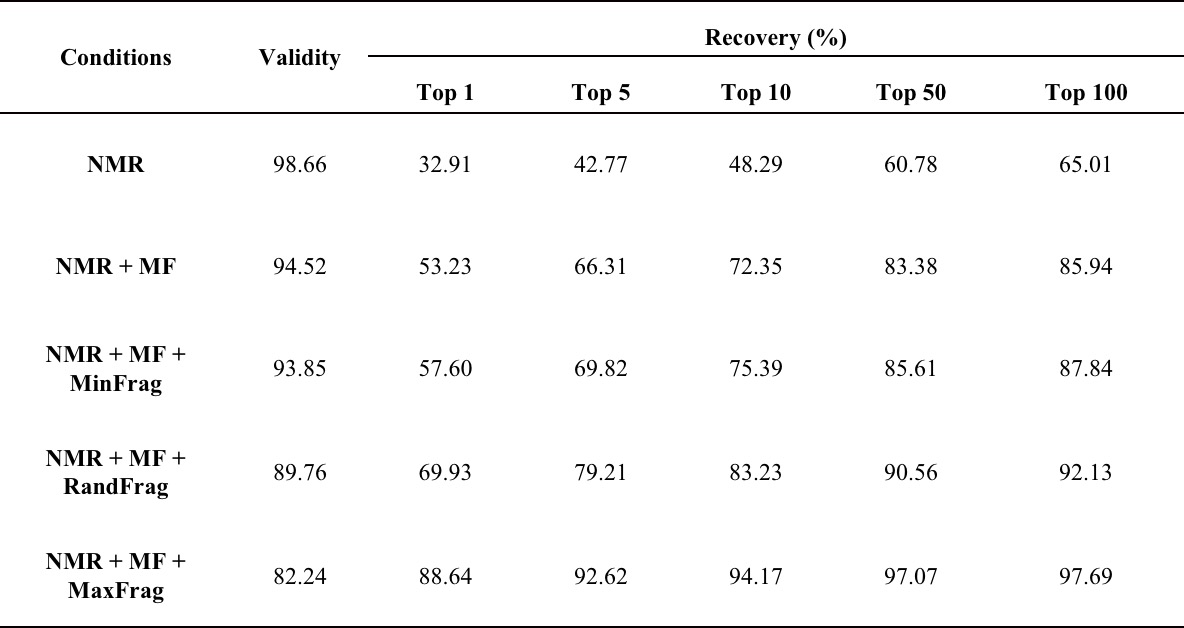
Note: MF-Molecular Formula, MinFrag-the Minimum Fragment, RandFrag-Random Fragment, MaxFrag-the Maximum Fragment.
5. Related Literature
[1] Cross-Modal Retrieval between (13)C Nmr Spectra and Structures for Compound Identification Using Deep Contrastive Learning. Yang, Z.; Song, J.; Yang, M., et al. Anal. Chem. 2021, 93, 16947−16955. DOI: 10.1021/acs.analchem.1c04307
[2] Conditional Molecular Generation Net Enables Automated Structure Elucidation Based on 13C NMR Spectra and Prior Knowledge. Yao L., Yang M., Song J., et al. Anal Chem. 2023 Mar 28;95(12):5393-5401. doi: 10.1021/acs.analchem.2c05817