ChemFH
1. Overview of ChemFH
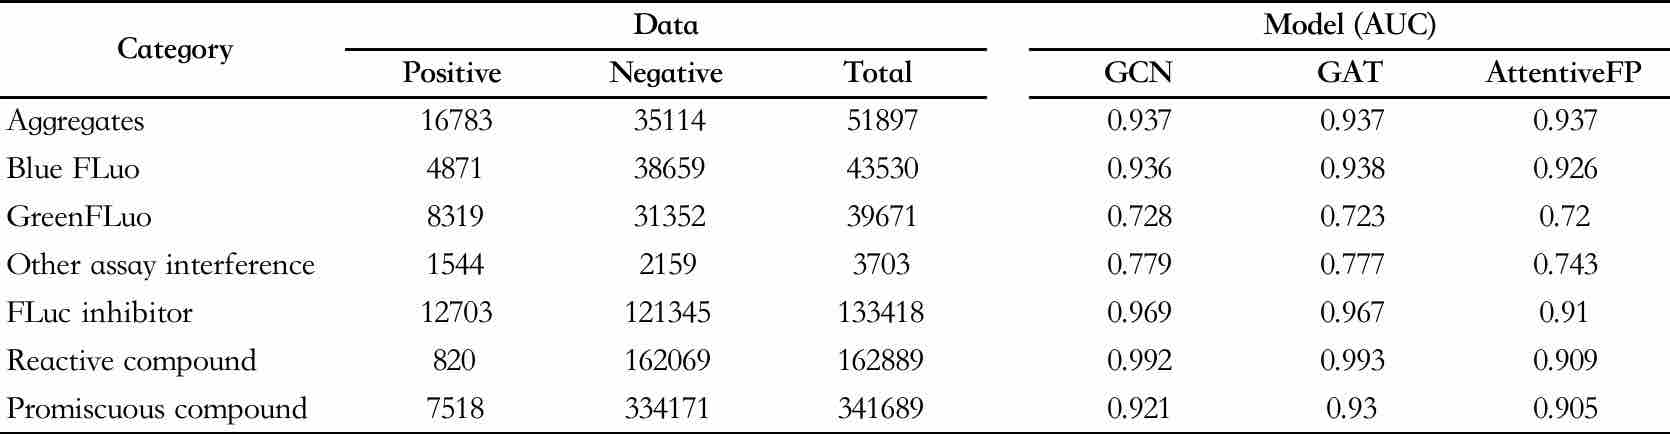
Chemical Frequent Hitter(ChemFH), is designed to identify compounds that frequently hit the test, including aggregates, Fluc inhibitors, promiscuous compounds, reactive compounds, blue/green fluorescent compounds, and other detection interferences compounds. These compounds severely interfere with the discovery of potentially active compounds, resulting in waste of time and resources. Based on the collection of massive high-quality databases and the application of the Graph Neural Networks architecture, ChemFH has a reliable ability to detect frequently hitters, thereby improving the efficiency of drug research and development.
Table 1. Modeling data and model evaluation results
2. Introduction of Use
Users only need three steps to complete the calculation: determine the input method - task naming(Optional field) - submit task(Mandatory field).
(1) Input Type
The platform provides four data input methods: paste SMILES, draw molecule, upload file, and data center.
- Paste SMILES
Check the box that says "Input SMILES" and then, in the text box, enter one or more SMILES expressions (use line breaks to input multiple SMILES). This text box can contain up to 500 SMILES. If you want to input more than this, you can submit the task by uploading a file.
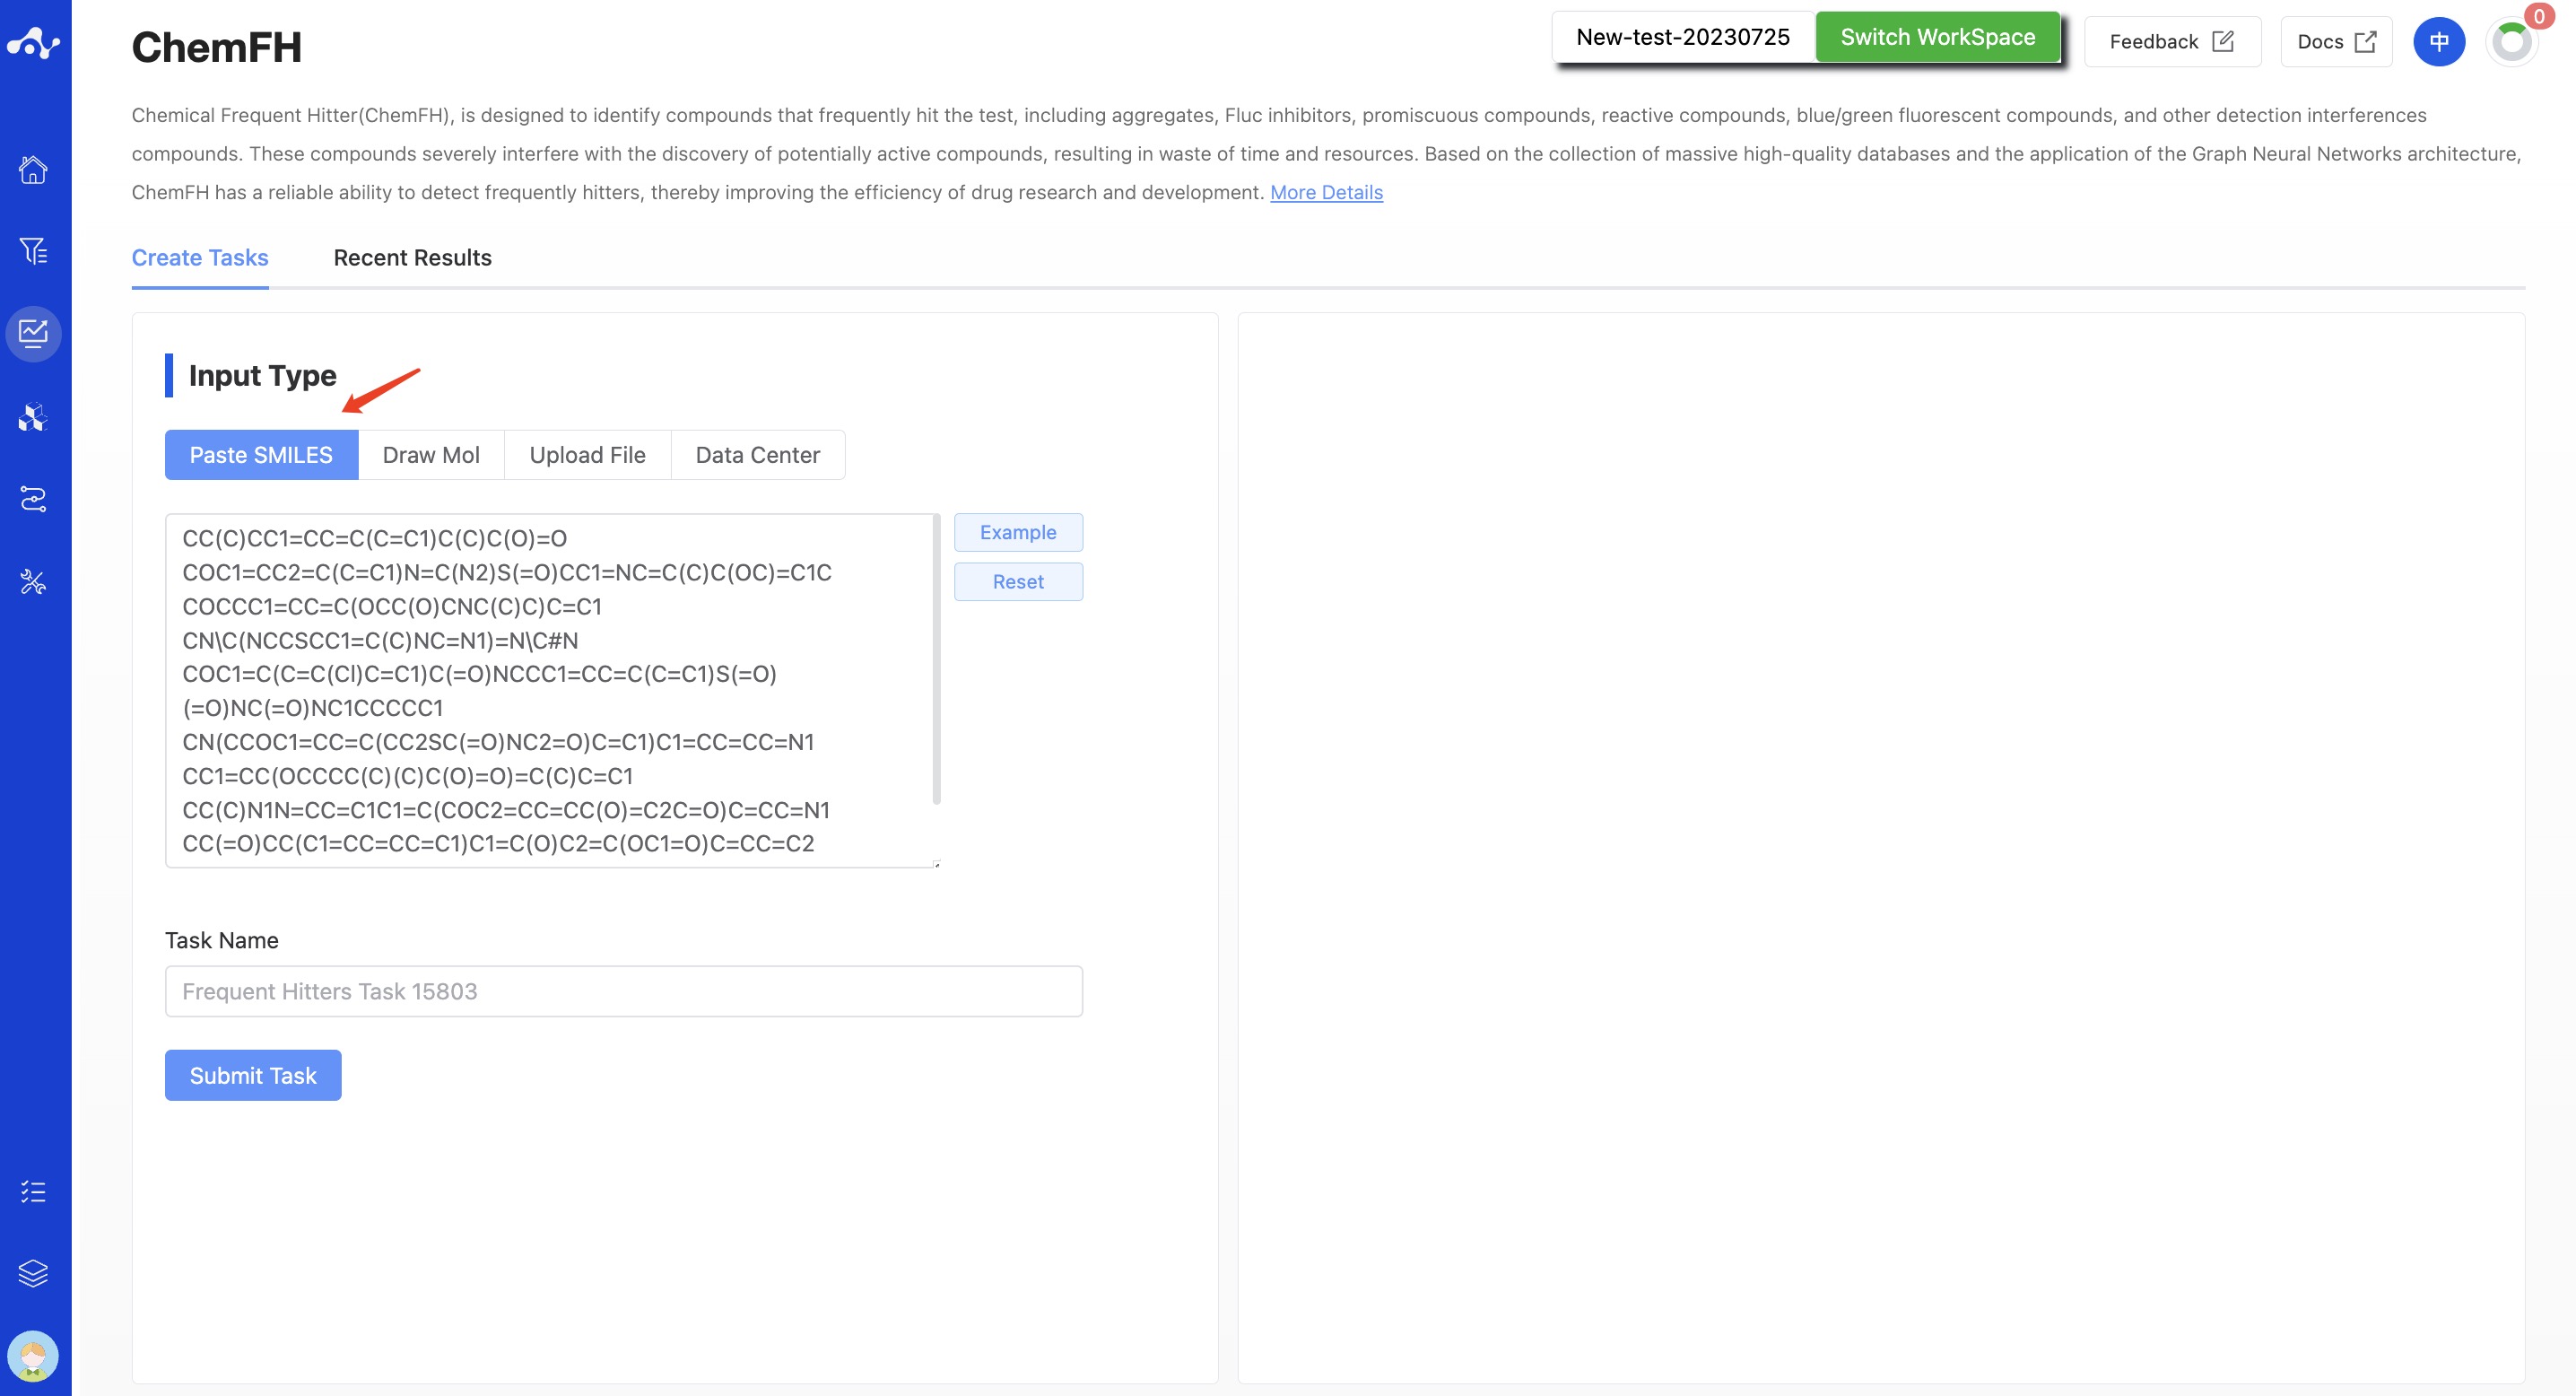
Figure 1. Input Type—— Paste SMILES
- Draw Molecule
Select "Drawing Molecules" in the check box and draw the molecular structure in the editor, and only one molecule can be drawn.
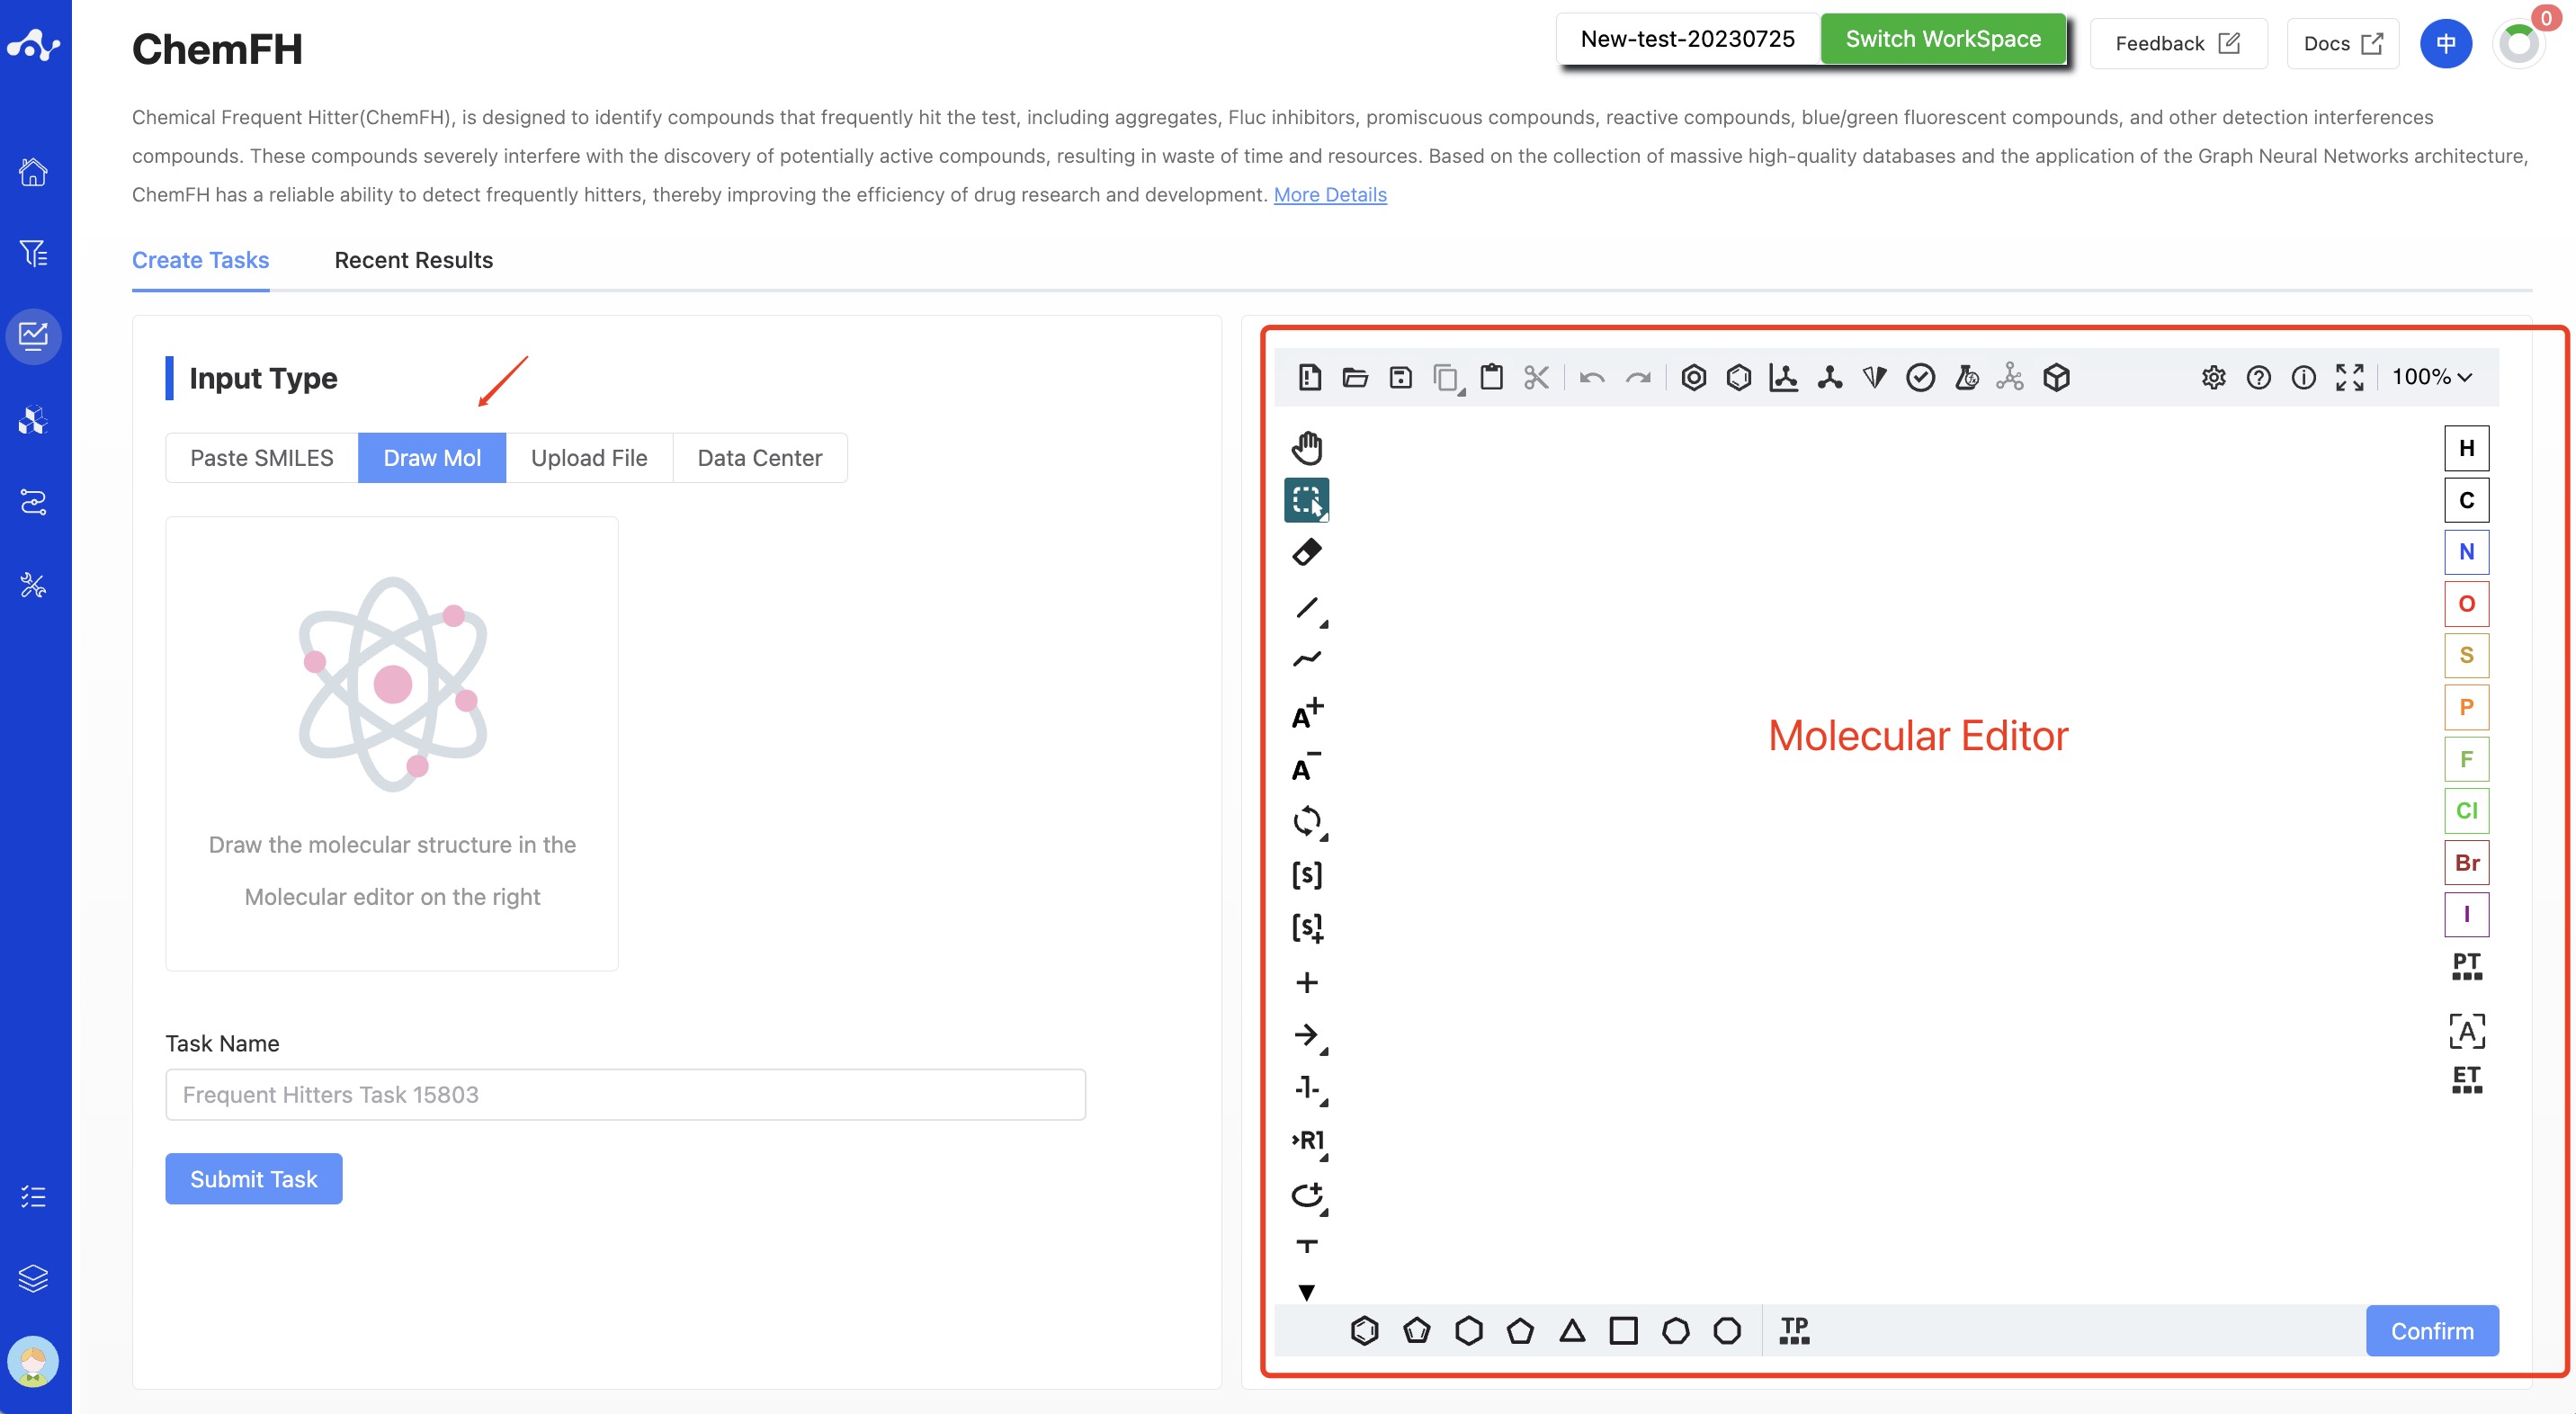
Figure 2. Input Type —— Draw Molecule
- Upload File
Check the "Upload File" box, and you can select a local file by clicking the button below. After the file is selected, the file name will be displayed on the button, and the file content will be displayed on the right. Regarding the uploaded files:
The currently supported file formats are .sdf and .csv. If an sdf file is uploaded, the task can be directly submitted. If a csv file is uploaded, you need to specify the smiles column before the task can be submitted.
The file size should not exceed 10MB.
- Data Center
Check the "Data Center" box, and a pop-up window will appear when you click the button below. Click on the file name to select data from the data center. After you click, the pop-up window will disappear and you can submit the task.
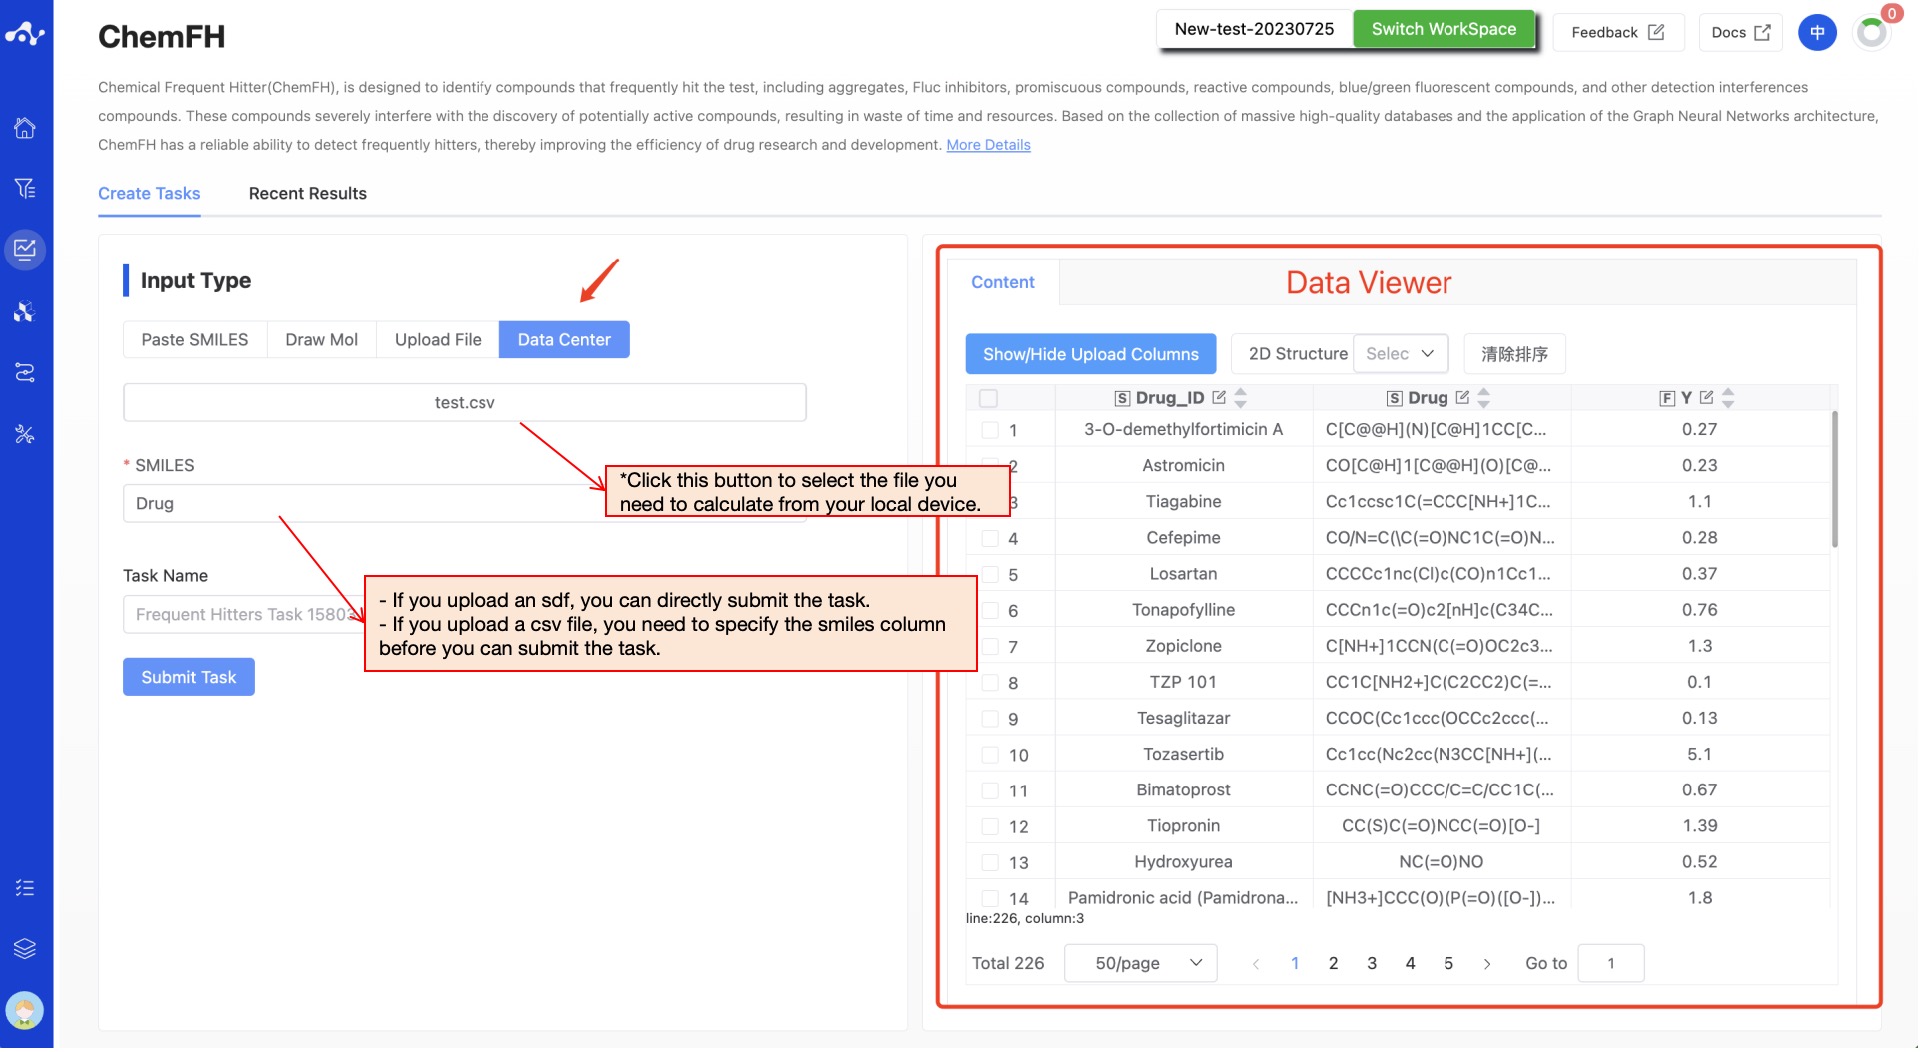
Figure 3. Input method——Upload File/Data Center
After all parameters are set, name the task and click 'Submit' to complete the task submission.
(2) Running Sataus and View Results
After the task is submitted, the page will automatically jump to the "Recent Results" subpage of the current page. Here you can view the task running status of the current module (progress bar), and you can also view all running tasks of all modules in the "Running" dropdown box in the upper right corner. When the data volume is large, the system will calculate in batches, so as long as a batch of data is calculated (while the entire task is still running), you can click the "Result Details" button to enter the result page and view the prediction result list of the currently completed calculations (molecules that have not completed the calculation will not be displayed temporarily). You can also refresh the current page to get the latest completed data.
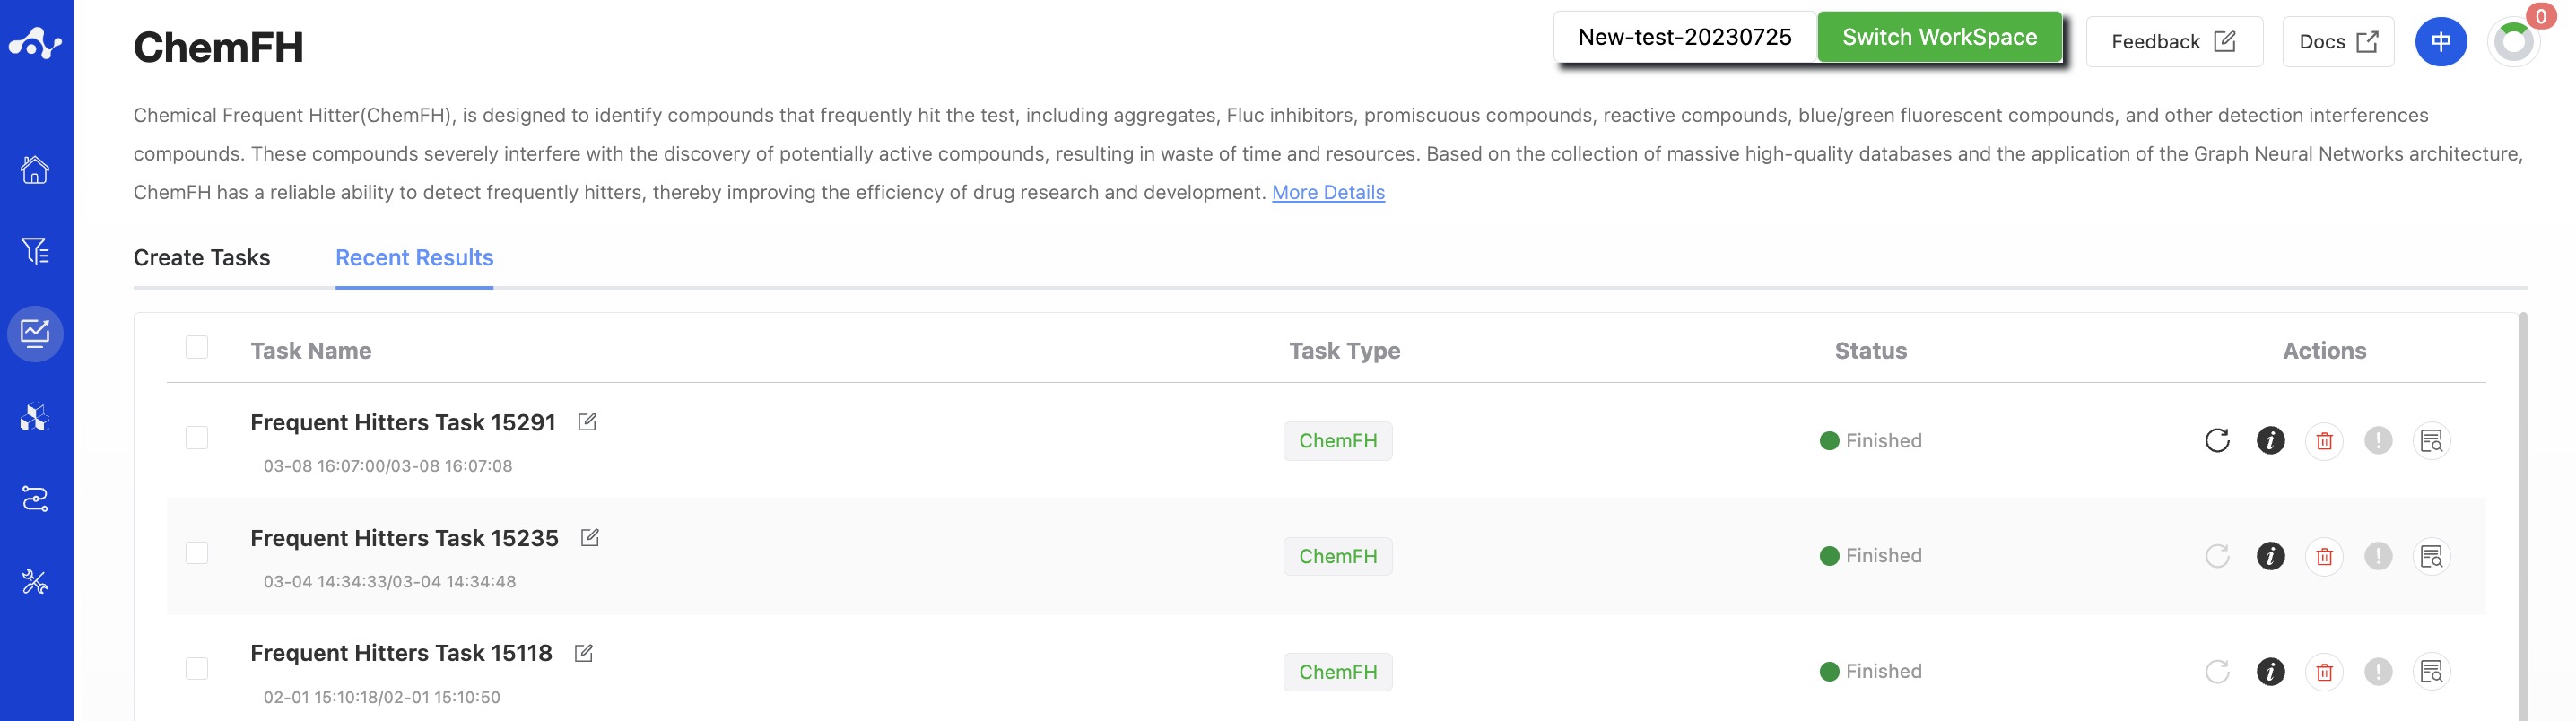
Figure 4. View Results
3. Results Analysis
The results page consists of a Summary at the top, a Filter area on the left, and a Results Details area in the center. By default, the Results Details area displays the results list (you can also switch to card subpages), where you can view all the predicted properties and sort and filter these properties. Meanwhile, to facilitate users to intuitively analyze the data, we have assigned a color to the predicted results.
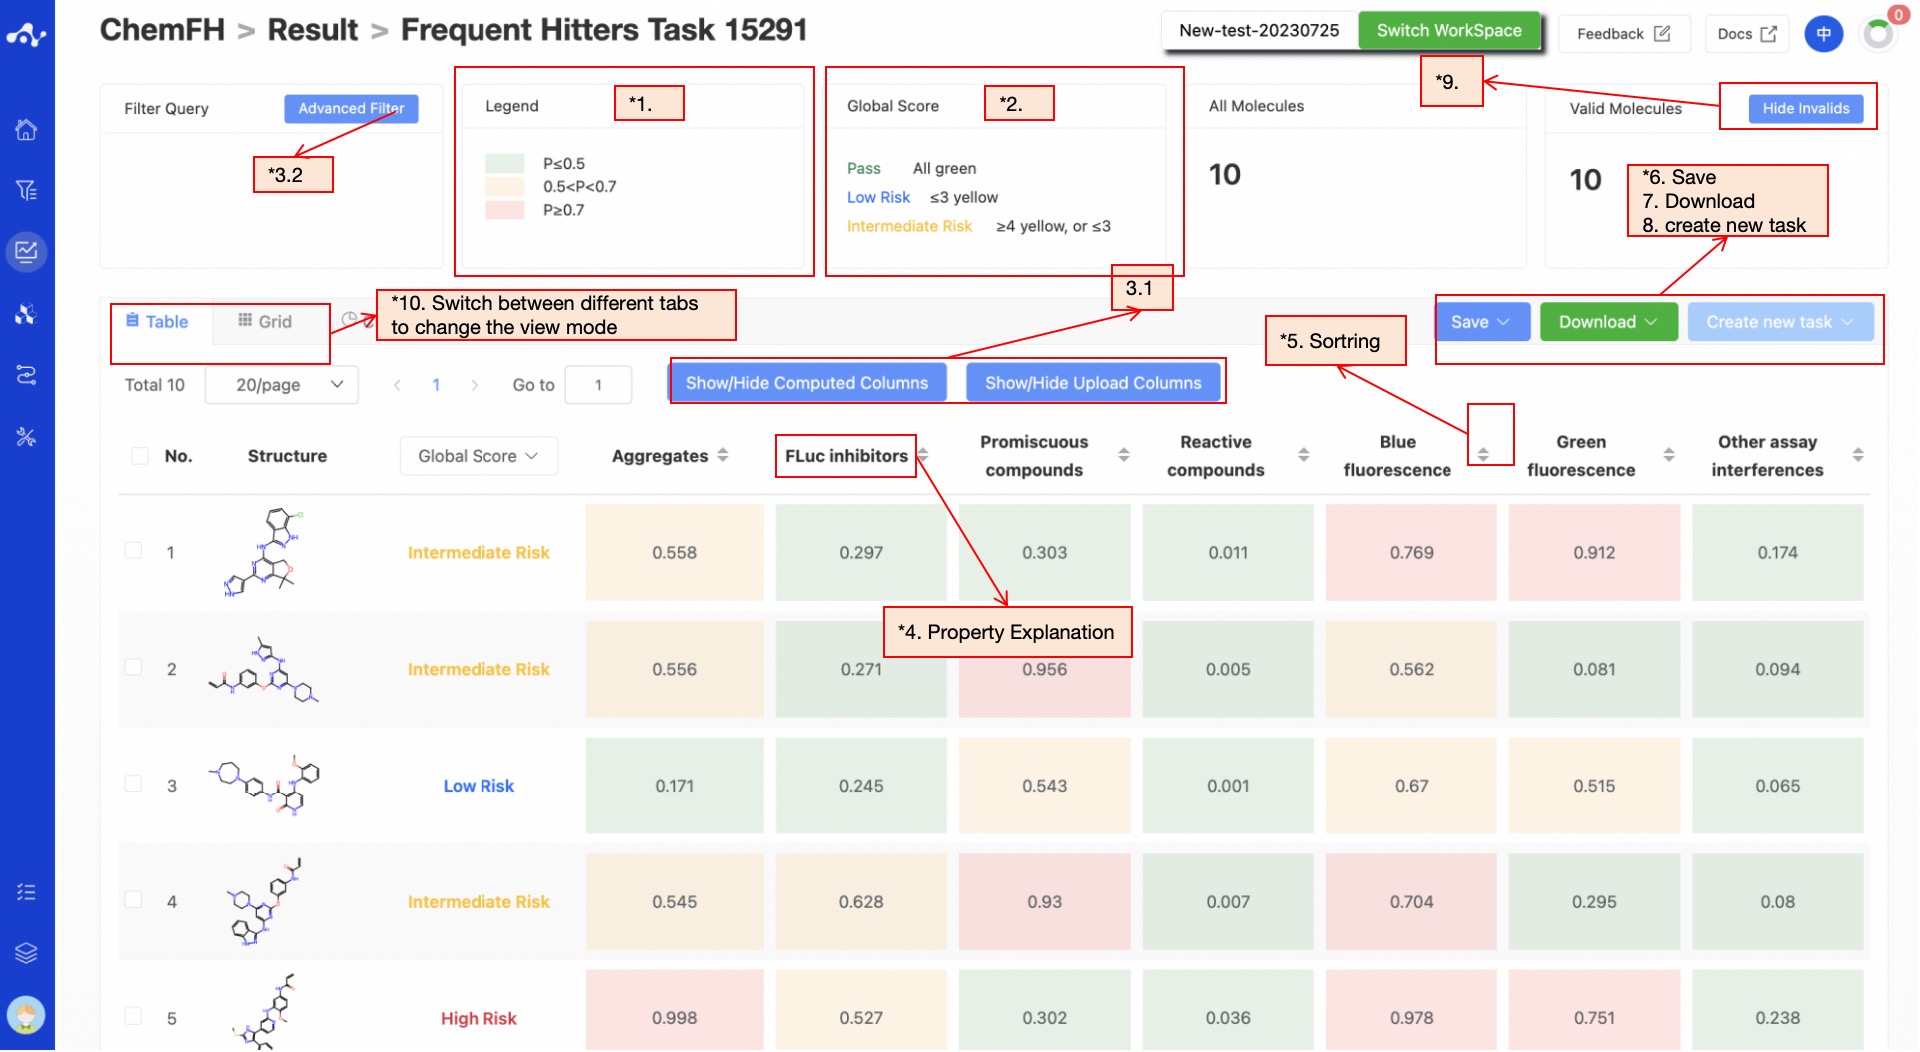
Figure 5. Results Page Function Distribution
(1) Definition of Color
Since different properties have different suggested value ranges, we made an intuitive evaluation of the prediction results by color. The rules for color setting are as follows:
P≤0.5, the background color of the value is green, which means that the predicted compound does not belong to this category;
05<P<0.7, the background color of the value is yellow, indicating that the predicted compound may belong to this category;
P≥0.7, the background color of the value is red, indicating that the predicted compound is likely to be this category.
(2) Definition of Global Score
Pass. When the predicted values of the compounds are all within the range of P≤ 0.5 (the background color is green);
Low risk. When the compound has less than 3 predicted alues at 0.5≤ P≤ 0.7(≤3 yellow);
Medium risk. When the compound has more than 4 predicted values at 0.5≤P≤0.7 (≥4 yellow), or when the compound has less than 3 predicted values at 0.5≤P≤0.7, and less than 2 predicted values within the range of P ≥0.7 (≤3 yellows and ≤2 reds);
High risk. When compounds have more than 3 predicted values in the range of P ≥ 0.7 (≥ 3 red).
(3) Filter
The platform provides general filter and advanced filter to meet the needs of users.
- General filter
General filters can show/hide properties. The default result list shows all the computed properties, and the control column on the left is in the selected state. When you do not want to display the property, just uncheck the property, and the result list on the left will be displayed in real time according to the selection in the control bar. Two shortcut keys "Select All" and "Select None" are also provided at the top, which is convenient for users to quickly select.
- Advanced filter
On the basis of general filter, advanced filter provides range screening, which can further screen out molecules within a specified range of a property to exclude molecules that do not meet the expected results.
(4) Attribute Interpretation
Hover your mouse over the name of each property to see the corresponding explanation.
(5) Sorting
Click the property name in the result list to re-sort, such as F(20%), click once to ascending order, click again to descending order, click again to restore the original sort.
(6) Save
Click "Save", and the system will pop up a dropdown box for you to choose the file format to save (currently only supports .csv/.sdf). Once you have determined the style of the file to save, save the corresponding data to the data center as a sdf or csv file. The saved content is the molecules of the effective number displayed on the page, which are usually obtained according to your show/hide column conditions, advanced filtering conditions, favorites, or dislikes.
(7) Download
Click "Download", and the system will pop up a dropdown box for you to choose the file format to download (currently only supports .csv/.sdf). After determining the style of the file to download, the system will download the corresponding data to your local device as a sdf or csv file. The content downloaded is consistent with the save method, which also downloads the molecules of the effective number displayed on the page, which are usually obtained based on your show/hide column conditions, advanced filtering conditions, favorites, or dislikes.
(8) Create New Task
The prerequisite for creating a new task is to first save the data into a file. Before the save operation is performed, this button is disabled. As soon as the new file is saved based on the results, this button is enabled. When you click this button, the system will pop up a dropdown box for you to select the module to be calculated. After clicking, the page will immediately open a new tab and will take your saved dataset with it. After adjusting the parameters, you can submit a new task.
(9) Hide Invalid Molecules
For SMILES errors or molecules that cannot be resolved in the back-end, the algorithm cannot perform the correct calculation, in which case the task is unaffected, but the molecule is defined as invalid. Users can use the "Hide invalid molecules" button to quickly filter out the part of the molecule.
(10) Card Subpage
On the card page, we provide a more concise way to view the results, where you can see the structure of the molecule and the probability value of it being a frequently hit compound in the corresponding category.
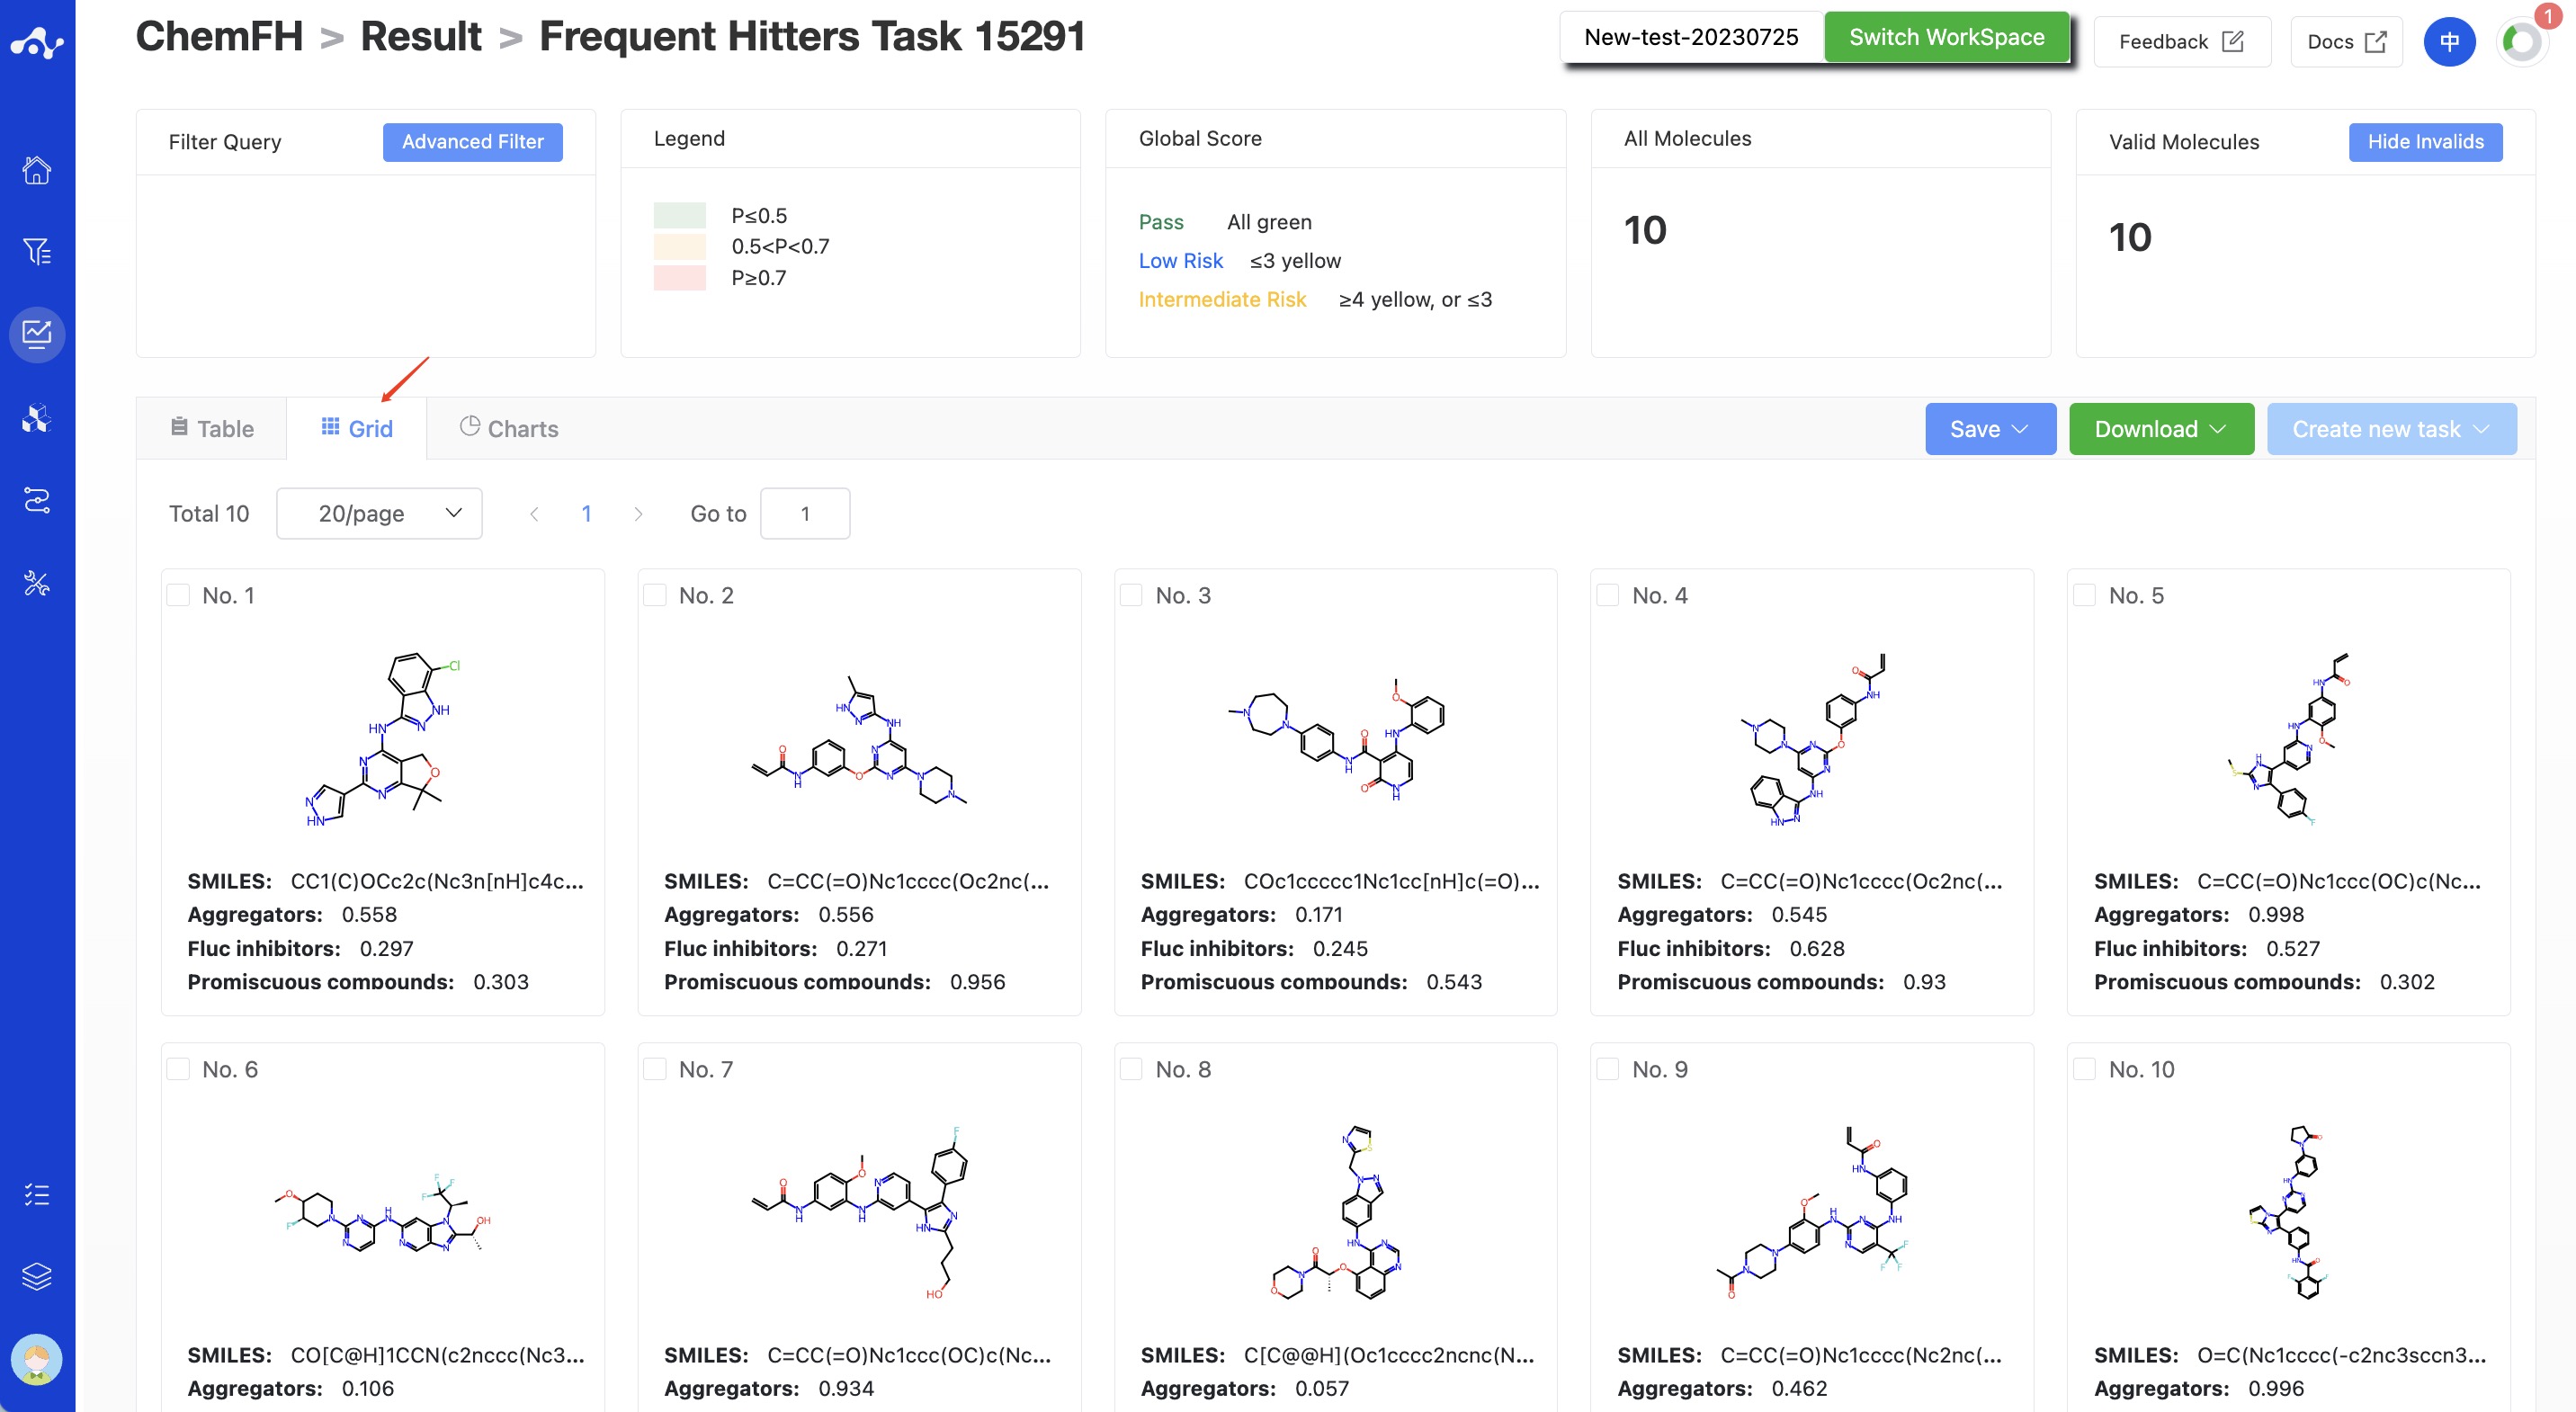
Figure 6. Grid Subpage
(11) Chart Subpage
On this chart page, we provide a pie chart for the risk level distribution of uploaded compounds being frequently hit compounds.
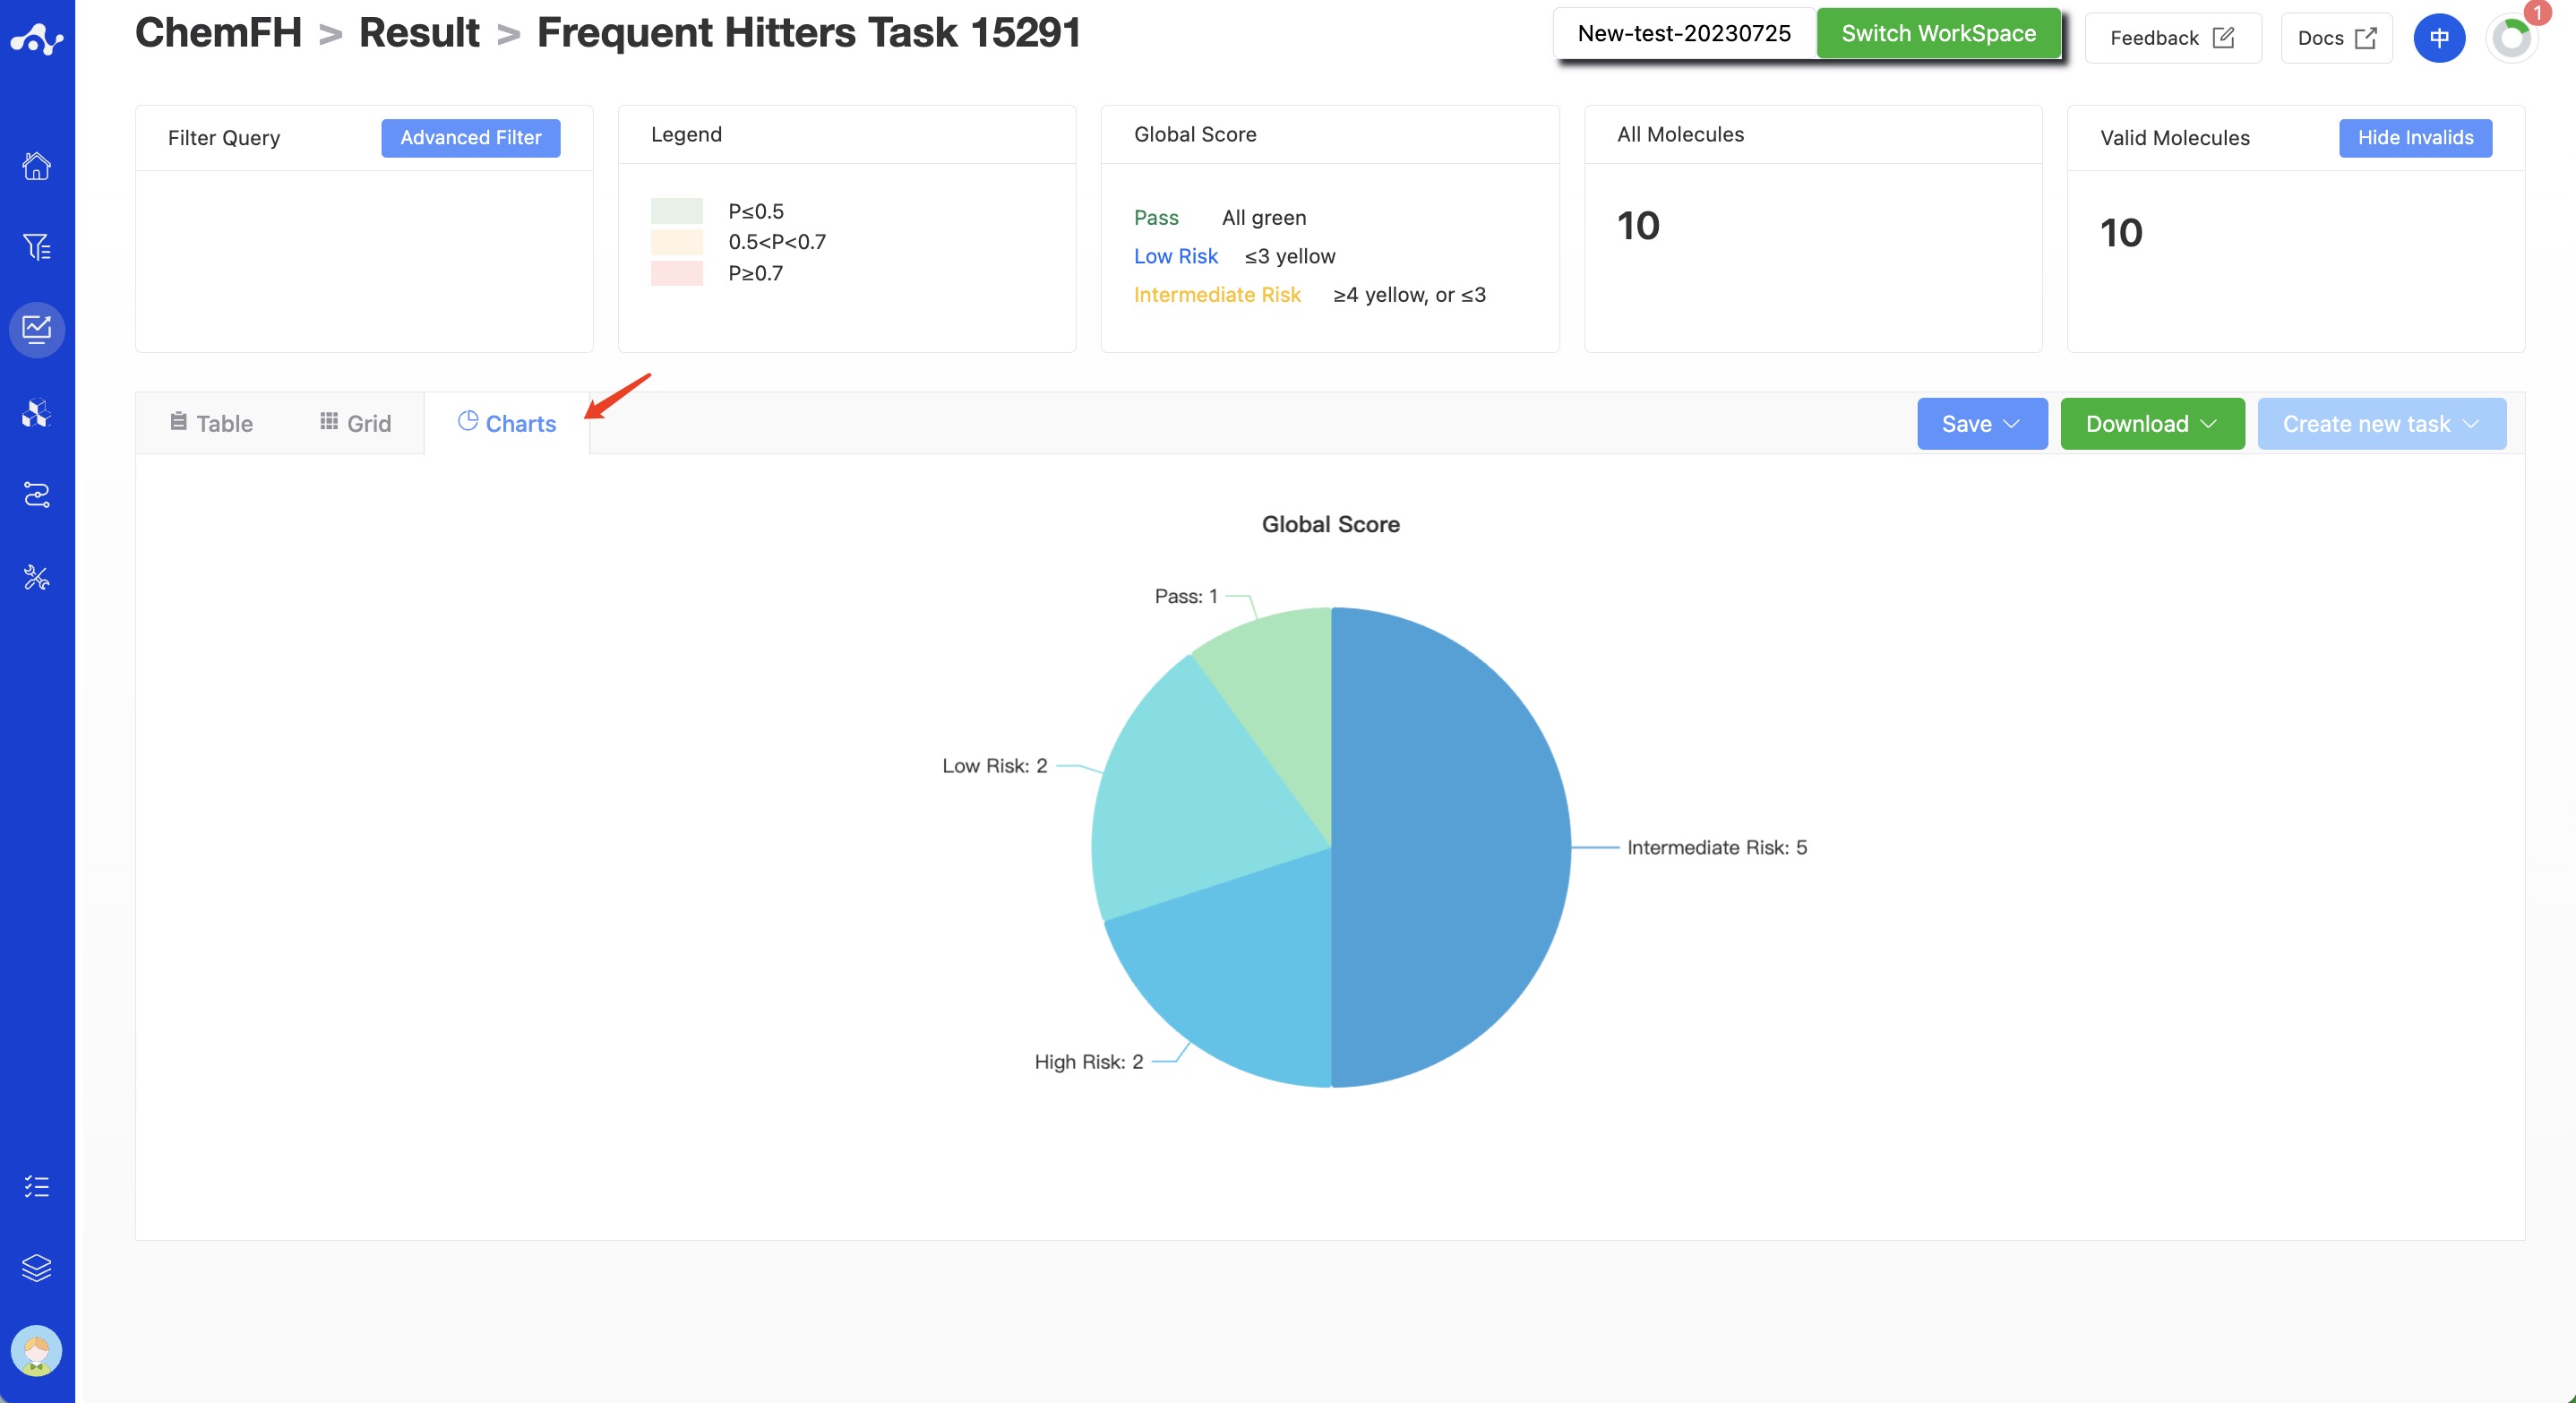
Figure 7. Chart Subpage