DrugFlow-Molstar Visualization Interface Operations
1. Overall Interface Introduction
The interface is shown in Figure 1. The top toolbar contains operation buttons (from left to right: selection tool, 2D interaction, screenshot, center view, auto-rotate, fullscreen); the structure tree is in the upper right corner; and the sequence is displayed at the bottom.
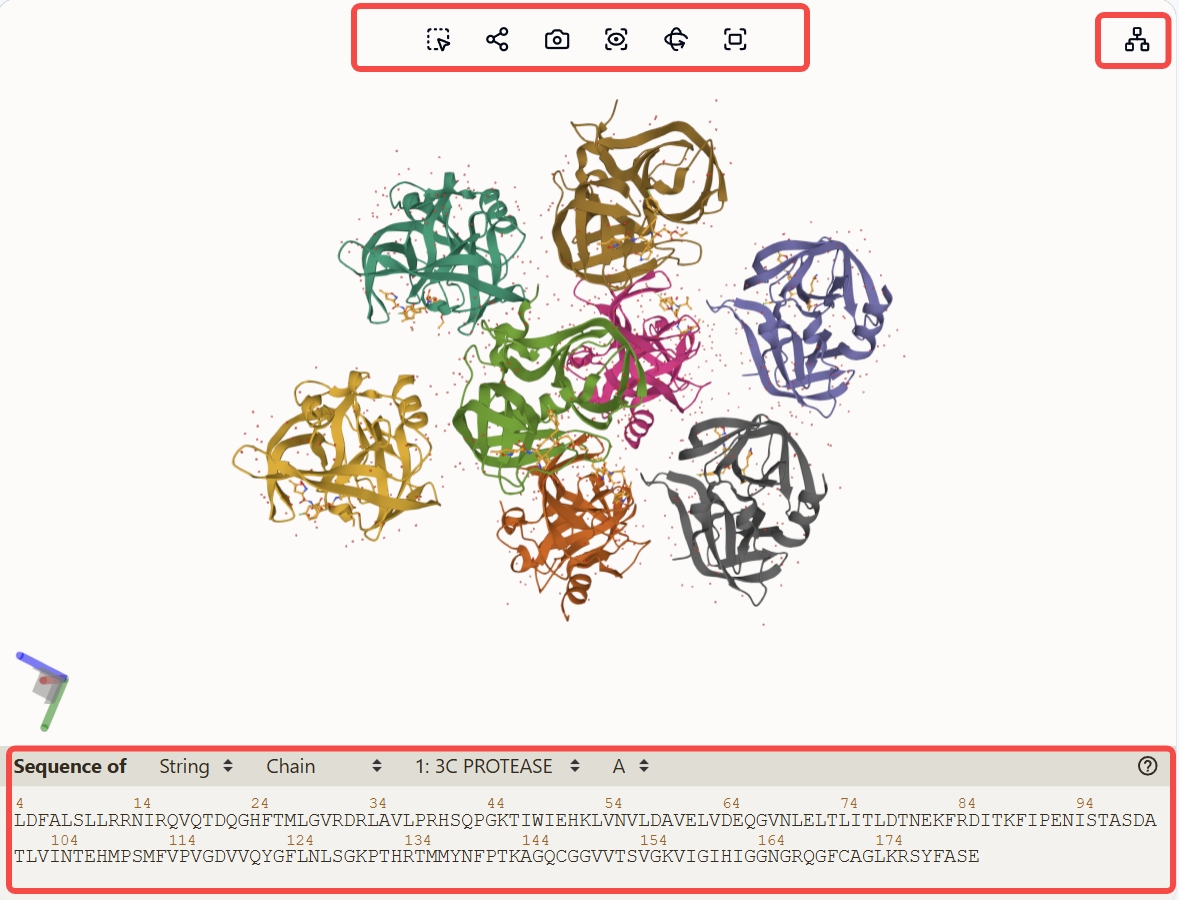
Figure 1 Display Interface
2. Mouse Operations
Left Click: Select Left Click + Drag: Rotate Scroll Wheel: Zoom in/out Right Click + Drag: Pan Right Click: Click on structure (focus on that structure); Click on empty space (center view)
3. Operation Buttons
3.1 Selection Tool
Click the selection tool, and the interface is shown in Figure 2, which is roughly divided into four parts: granularity, operations, expand selection, and quick selection.
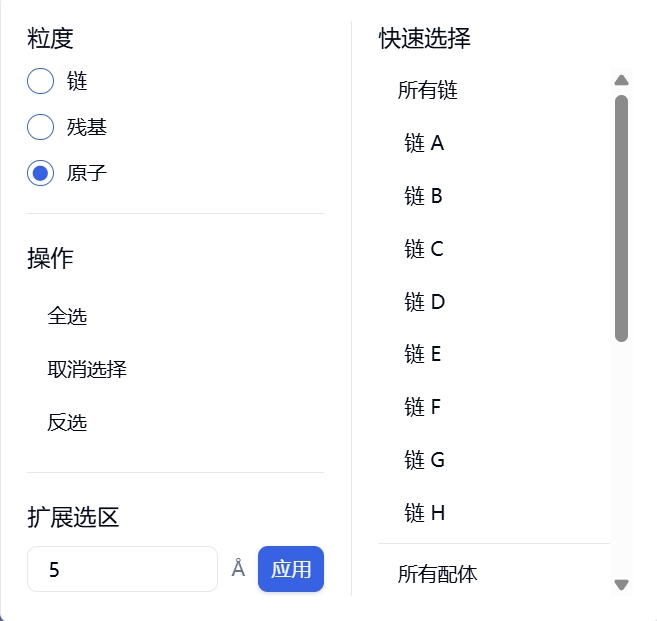
Figure 2 Selection Tool
Granularity
- Chain: Left click to select one chain at a time
- Residue: Left click to select one residue at a time
- Atom: Left click to select one atom at a time
Operations
- Select All: Select all structures in the interface
- Deselect: Cancel all selections
- Invert Selection: Select all structures in the interface (except currently selected ones)
Expand Selection
- Select all structures within a specified range around the currently selected structure, default is 5Å
Quick Selection
- Quickly select all chains/a specific chain/all ligands/a specific ligand/all water molecules
3.2 2D Interaction
Display 2D interaction of molecules in the interface (only available on result pages).
3.3 Screenshot
Save the current interface as an image.
3.4 Center View
Center display of all structures.
3.5 Auto-Rotate
Automatically rotate the structures displayed in the current interface.
3.6 Fullscreen
Display the current structure in fullscreen mode.
4. Structure Tree
Click the structure tree and expand it by clicking ">", as shown in Figure 3. The structure tree is roughly divided into two levels: the first level is Model, which includes all structures in the interface; the second level includes Polymer, Component, Water, etc.
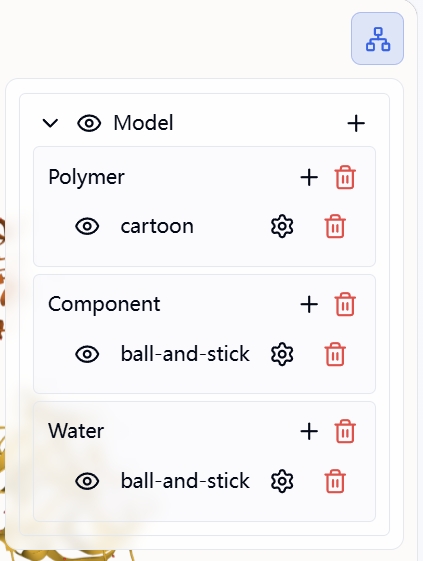
Figure 3 Structure Tree Diagram
Operations
- Click the "eye" icon to hide/show corresponding structures
- Click "+" after Model to add components, such as Polymer, Component, etc.
- Click "+" after Polymer, Component, Water, etc. to add representations, such as Cartoon, Stick, etc.
- Click "delete" to remove corresponding components or representations (only removes the display, the actual structure remains in the file)
Edit Representation When we click "settings" after a representation, the edit representation panel appears, as shown in Figure 4. Edit representation is divided into three parts: transparency, color, and delete representation.
- Transparency: Range is 0-1, closer to 0 means more transparent
- Color: Four automatic color setting methods, including element symbol, chain ID, uniform, and hydrophobicity
- Delete Representation: Click to delete the representation
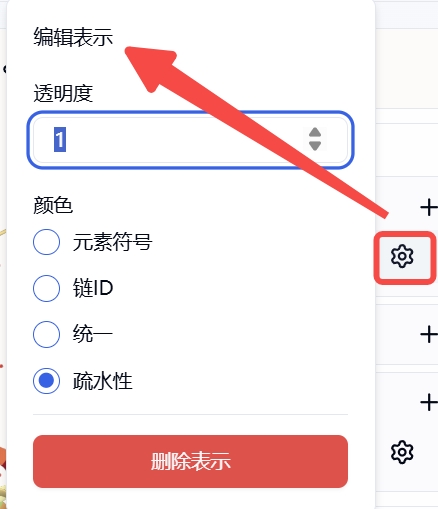
Figure 4 Edit Representation
Sequence
Chain is selected by default, as shown in Figure 5. Click Chain, and there are three different options:
- Chain: Display the sequence of a specific chain
- Polymers: Display sequences of polymers, such as all protein chains
- Everything: Display all structures, including proteins, ligands, water, etc.
Click on a residue in the sequence, and it will be marked with a green background in the sequence and selected in the 3D area.
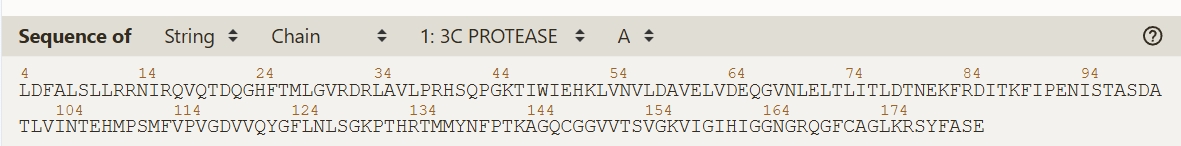
Figure 5 Sequence
5. Add Representation to Selected Residues
When we select one or more residues through the selection tool or by clicking on the sequence, an option to add representation to selected residues appears in the structure tree, as shown in Figure 6. You can add representations to the selected residues.
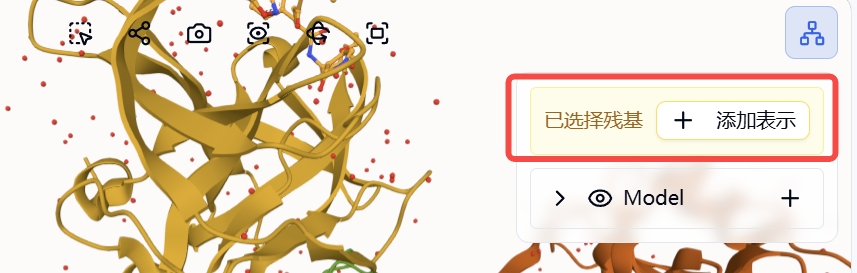
Figure 6 Add Representation to Selected Residues